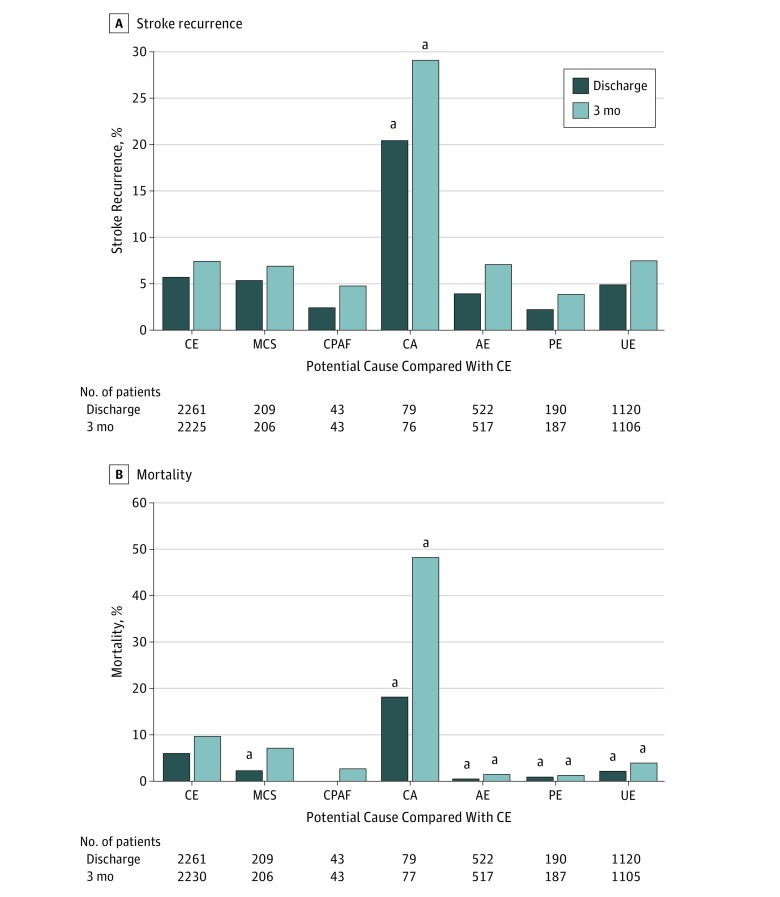
Figure 3. Stroke Recurrence and Mortality.
Rates of stroke recurrence (A) and mortality (B) are shown according to each potential cause compared with cardioembolic stroke (CE). Patients whose data regarding stroke recurrence or mortality at 3 months were missing were excluded from the analysis for the respective adverse events at 3 months. The number of patients in each group is shown below the graph. AE indicates arteriogenic emboli; CA, cancer associated; CPAF, covert paroxysmal atrial fibrillation; MCS, minor-risk potential cardioembolic sources; PE, paradoxical embolism; and UE, undetermined embolism.
aStatistically significant at P < .05 vs CE by multiple comparisons.

