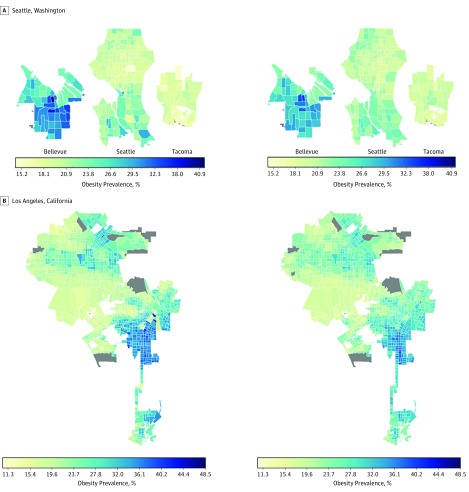
Figure 2. Actual Obesity Prevalence and Cross-Validated Model Estimates of Obesity Prevalence in High-Prevalence Areas.
Images on the right represent actual obesity prevalence; on the left, cross-validated estimates of obesity prevalence based on features of the built environment extracted from satellite images. Images from the Seattle region include Bellevue, Seattle, and Tacoma. The gray shaded regions do not have data.

