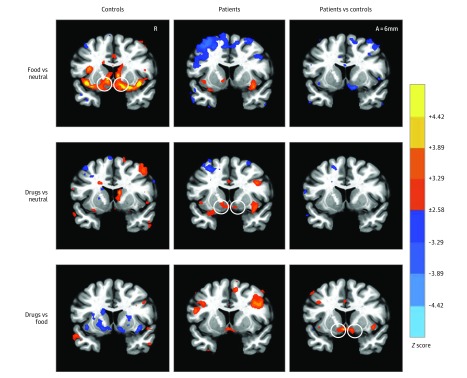
Figure 2. Contrasts of Neural Responses to Food, Drug, and Neutral Cue Trials in Patients and Controls.
Whole-brain maps (coronal view, 6 mm anterior [A] to the anterior commissure) show activations at a voxelwise threshold of P < .01 (uncorrected for display; each color increment depicts an order of magnitude increase). Activation maps specifically depict contrasts for controls (left), patients (middle), and patients vs controls (right). Circles highlight predicted contrasts in nucleus accumbens volumes of interest. R indicates right.

