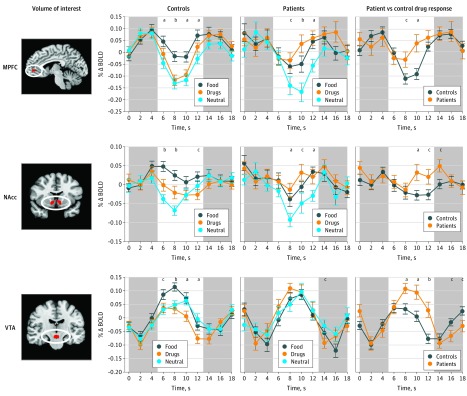
Figure 3. Mesolimbic Volume of Interest Responses to Different Cue Stimuli for Patients and Controls.
Activity time courses were extracted from predefined volumes of interest and averaged by trial type to compare responsiveness in patients vs controls. Controls showed a higher response to food stimuli than drug and neutral stimuli in all volumes of interest (middle left). Patients showed a higher response to food and drug stimuli than neutral stimuli in the medial prefrontal cortex (MPFC) and nucleus accumbens (NAcc), but not the ventral tegmental area (VTA) (middle right). Patients showed a higher response to drug cues than controls in all mesolimbic volumes of interest (right). Circles represent means and error bars depict SEM across participants. The x-axes represent time elapsed from trial onset, with white areas corresponding with the time of trial presentation (2-second shape presentation, 2-second image presentation, and 4-second rating period; shifted to account for a 6-second hemodynamic lag). In control and patient plots, P values indicate results of repeated-measures analysis of variance testing for differences across cue stimuli. In patient vs control drug response plots, P values indicate results from 2-sample t tests. All P values are 2-tailed. Δ indicates change; BOLD, blood oxygen level dependent activity. Areas in red within ovals represent volumes of interest.
aP < .01.
bP < .001.
cP < .05.

