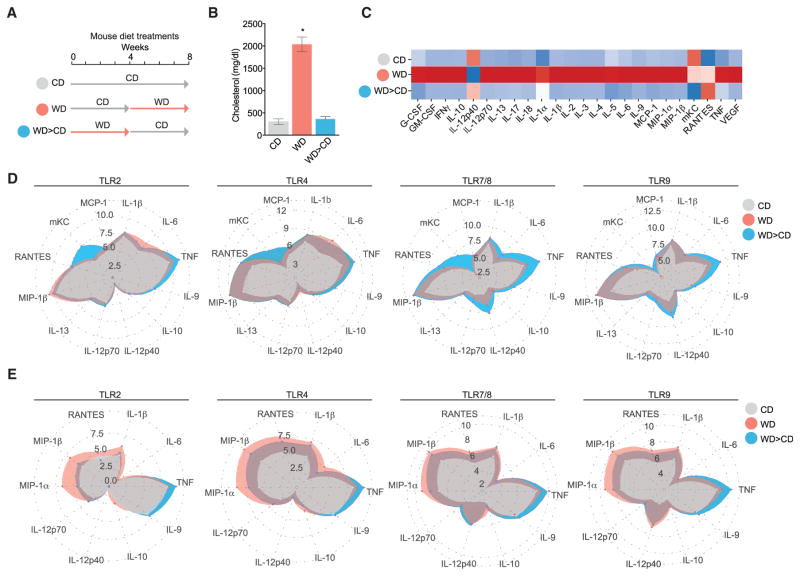
Figure 1. WD Feeding Induces Systemic Inflammation and Functional Reprogramming.
(A) Schematic of dietary interventions. Female Ldlr−/− mice were fed either CD, WD for 4 weeks, or WD for 4 weeks followed by CD for 4 weeks (WD > CD).
(B) Systemic serum cholesterol in response to dietary intervention in Ldlr−/− mice.
(C) Heatmap representing normalized serum cytokine levels from mice fed as indicated.
(D and E) Bone marrow cells (D) or splenic CD11b+ monocytes (E), isolated from Ldlr−/− mice following dietary intervention treated ex vivo with vehicle or different TLR stimuli for 6 hr. Log 2 transformed data represented as spider plots for the following stimulations: Pam3Csk4, LPS, R848, and CpG.
For (B) n = 6–10 animals; for (C) n = 3–5 animals per group; ± SEM, p < 0.05 versus CD (B and C); versus un-stimulated cells (D and E). Experiments were performed twice independently and data are representative of a single experiment.

