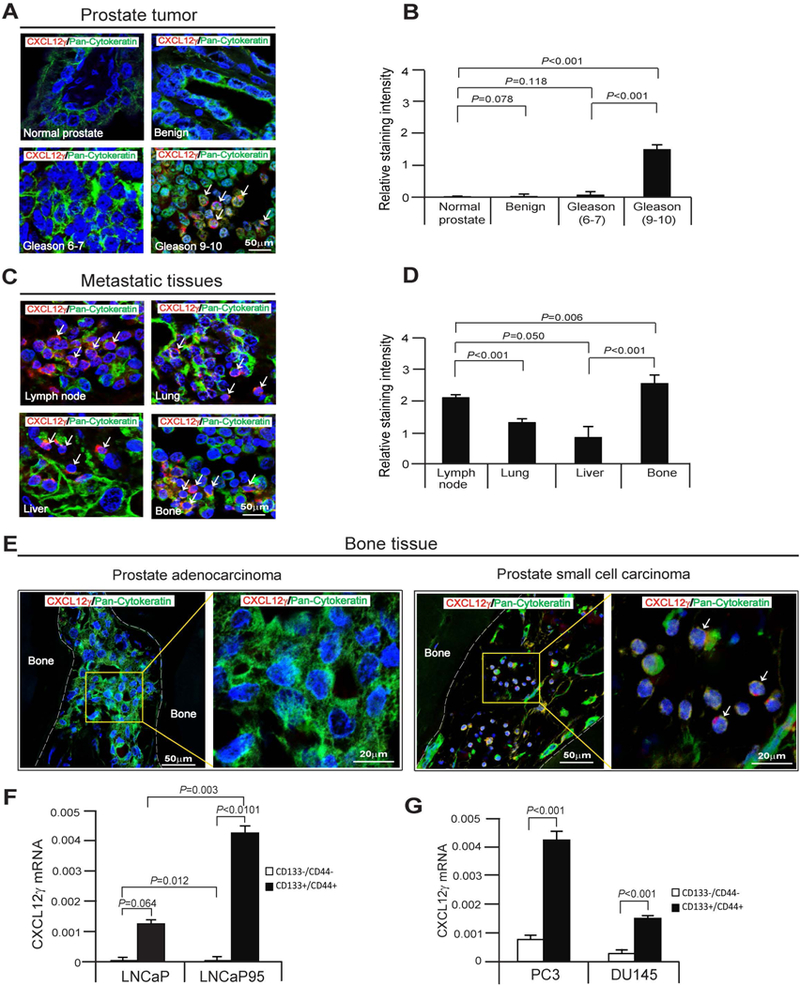
Figure 1. CXCL12γ expression in PCa patient tissues and m-CRPC cells.

A, Human prostate tissue microarrays (TMAs) from The Tissue Core of the University of Michigan Comprehensive Cancer Center and US Biomax Inc., were stained for CXCL12γ (red) or pan-cytokeratin (green). Cells expressing both markers are indicated with white arrows. DAPI nuclear stain (blue). Bar=50μm. TMAs consist of normal prostate tissues (n=8), benign (n=6), Gleason 6–7 prostate cancer tissues (n=12), Gleason 9–10 prostate cancer tissues (n=25). B, Quantification of Fig. 1A. C, Human prostate metastatic tissues from The Tissue Core of the University of Michigan Comprehensive Cancer Center were stained for CXCL12γ (red) or pan-cytokeratin (green). Metastatic tissues are lymph node (n=15), lung (n=10), liver (n=12), and bone (N=19). D, Quantification of Fig. 1C. E, Left panel: CXCL12γ (red) expression in pan-cytokeratin (green) expressing prostate adenocarcinoma in human bone tissue as detected by immunofluorescence staining, and the magnification of the yellow rectangle from left panel. Bar=20–50μm. Right panel: CXCL12 γ (red) expression in pan-cytokeratin (green) expressing a small cell carcinoma phenotype in human bone tissue as detected by immunofluorescence staining, and the magnification of the yellow rectangle from right panel (white arrows). Bar=20–50μm. F, mRNA expression of CXCL12γ in CSCs (CD133+/CD44+) or non-CSCs (CD133-/CD44-) from LNCaP cells or a castration-resistant sub-line of the LNCaP cells, LNCaP95 as quantified by real-time PCR. G, mRNA expression of CXCL12γ in CSCs (CD133+/CD44+) or non-CSCs (CD133-/CD44-) from the metastatic cell lines PC3 and DU145 as quantified by real-time PCR. Data in Fig. 1B, 1D, 1F, and 1G are representative of mean ± SD (Student’s t-test).
