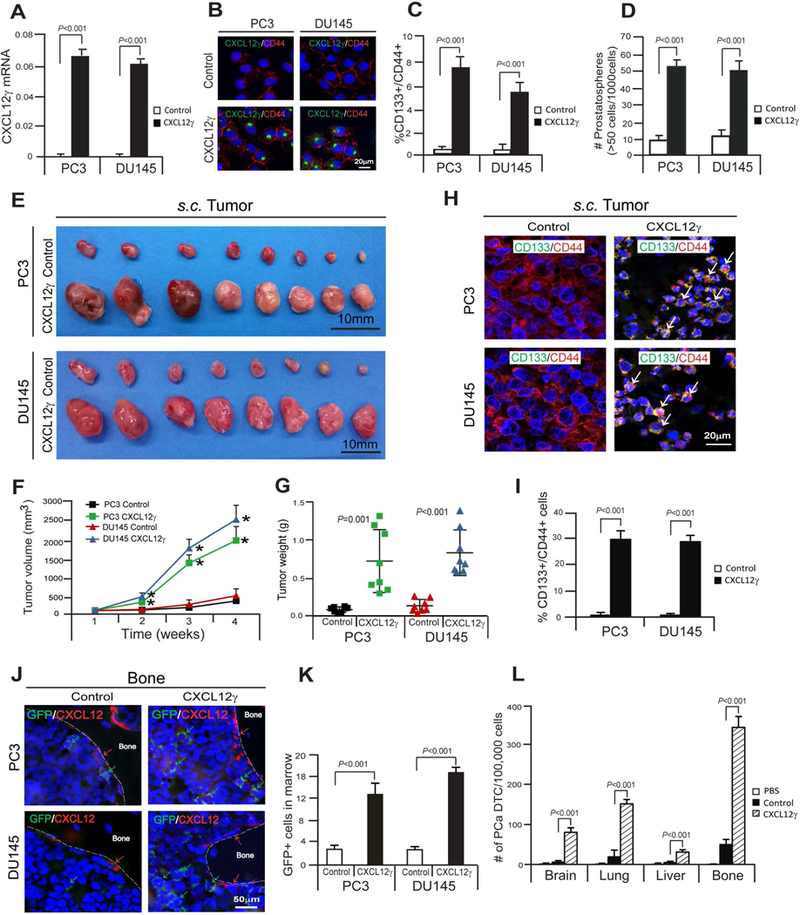
Figure 2. CXCL12γ induces CSCs, which promotes prostate tumor growth and metastasis.

A, Verification of CXCL12γ mRNA expression in CXCL12γ overexpressing PCa cells, PC3 and DU145, as quantified by real-time PCR. B, Verification of CXCL12γ protein expression in CXCL12γ overexpressing PCa cells, PC3 and DU145 as detected by immunofluorescence staining. CXCL12γ (green). CD44 (red). DAPI nuclear stain (blue). Bar=20μm. C, FACS analyses of the CSC (CD133+/CD44+) phenotype in CXCL12γ overexpressing or control PCa cells. D, The formation of prostatospheres in CXCL12γ overexpressing or control PCa cells. Data in Fig. 2A, 2C, and 2D are presented as mean ± SD (Student’s t-test). E-G, The GFP-expressing PCa cells overexpressing CXCL12γ or control cells were implanted s.c. into 5–7 week-old male SCID mice (n=8/group). After 4 weeks, mice were sacrificed and tumor growth was evaluated. *P<0.001. H, Immunostaining of CD133 (green) and CD44 (red) (white arrow) of s.c. PCa tumors generated by CXCL12γ overexpressing PCa cells or control cells. I, Quantification of Fig. 2H. Data are representative of mean ± SD (Student’s t-test). J, GFP-expressing PCa cells were identified in the femur of SCID mice following s.c. injection in Fig. 2E. Green arrows identify GFP-expressing PCa cells. Red arrows identify osteoblast on the bone surface staining positive for CXCL12 expression. Bar=50μm. K, Quantification of Fig. 2J. The numbers of GFP-expressing PCa cells were quantified on the endosteal region of the 10 long bones. Endosteal regions were defined as 12 cell diameters from bone surfaces. Mean ± SD (Student’s t-test) (n=10). L, PCa cells overexpressing CXCL12γ or control cells (1 × 10⁶ cells) were injected into male CB.17. SCID mice (5–7 weeks of age: Charles River, Wilmington, MA) by intracardiac (i.c.) injection. Groups were PBS (n=2), PC3-control cells (n=7), and PC3 CXCL12γ overexpressing cells (n=8). Disseminated prostate tumor cells numbers (PCa DTC) were analyzed on a FACSAria II Cell Sorter by gating on mouse MHC negative and HLA-ABC positive cells from brain, lung, liver, and bone tissues 72 h later. Data are presented as mean ± SD (Student’s t-test).
