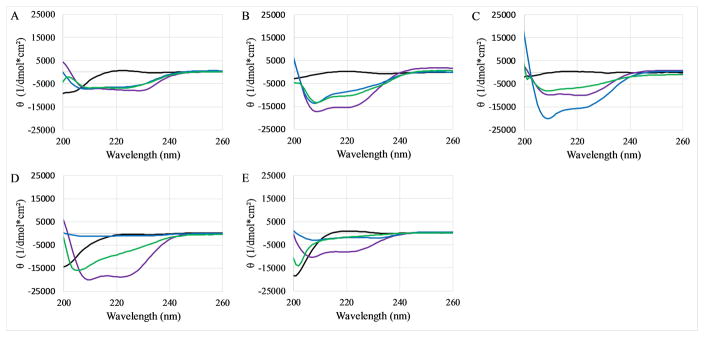
Figure 4. CD spectra of peptides.
CD spectra of peptides were collected in 10x diluted PBS (black), in the presence of 10mM SDS (blue), in the presence of 250μM PC:PG vesicles (green), or dispersed in 50:50 PBS:TFE (purple). The graphs represent (A) PBP, (B) PBP-W11, (C) PBP-W18, (D) PBP-X, (E) PBP-A. In all cases peptide concentration was 5 μM. All data represent the average of 64 scans after subtraction of background spectra lacking peptide.

