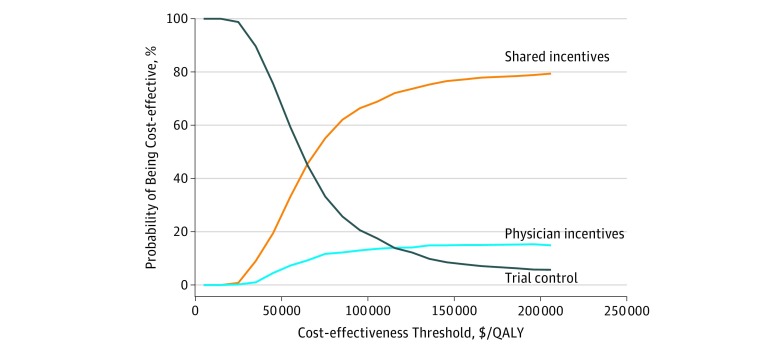
Figure 3. Cost-effectiveness Acceptability Curve for the Probabilistic Sensitivity Analysis.
The shared-incentives strategy was most likely to be optimal using a willingness-to-pay threshold (2017 US dollars) of $100 000/quality-adjusted life-year (QALY) (69% of probabilistic sensitivity analysis iterations) followed by trial control strategy (18% of probabilistic sensitivity analysis iterations).

