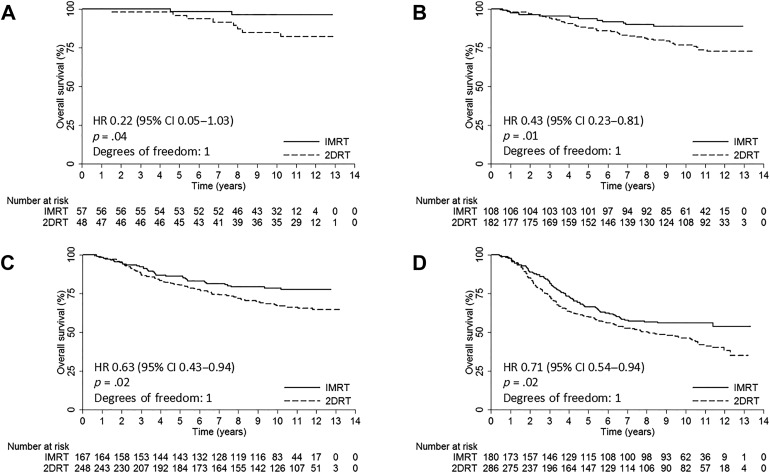
Figure 2.
Kaplan‐Meier overall survival curves for the IMRT group and the 2DRT group. (A): Stage I. (B): Stage II. (C): Stage III. (D): Stage IVA–B. HRs were calculated by the unadjusted Cox proportional hazards model. P values were calculated by the unadjusted log‐rank test.
Abbreviations: 2DRT, two‐dimensional radiotherapy; CI, confidence interval; HR, hazard ratio; IMRT, intensity‐modulated radiotherapy.

