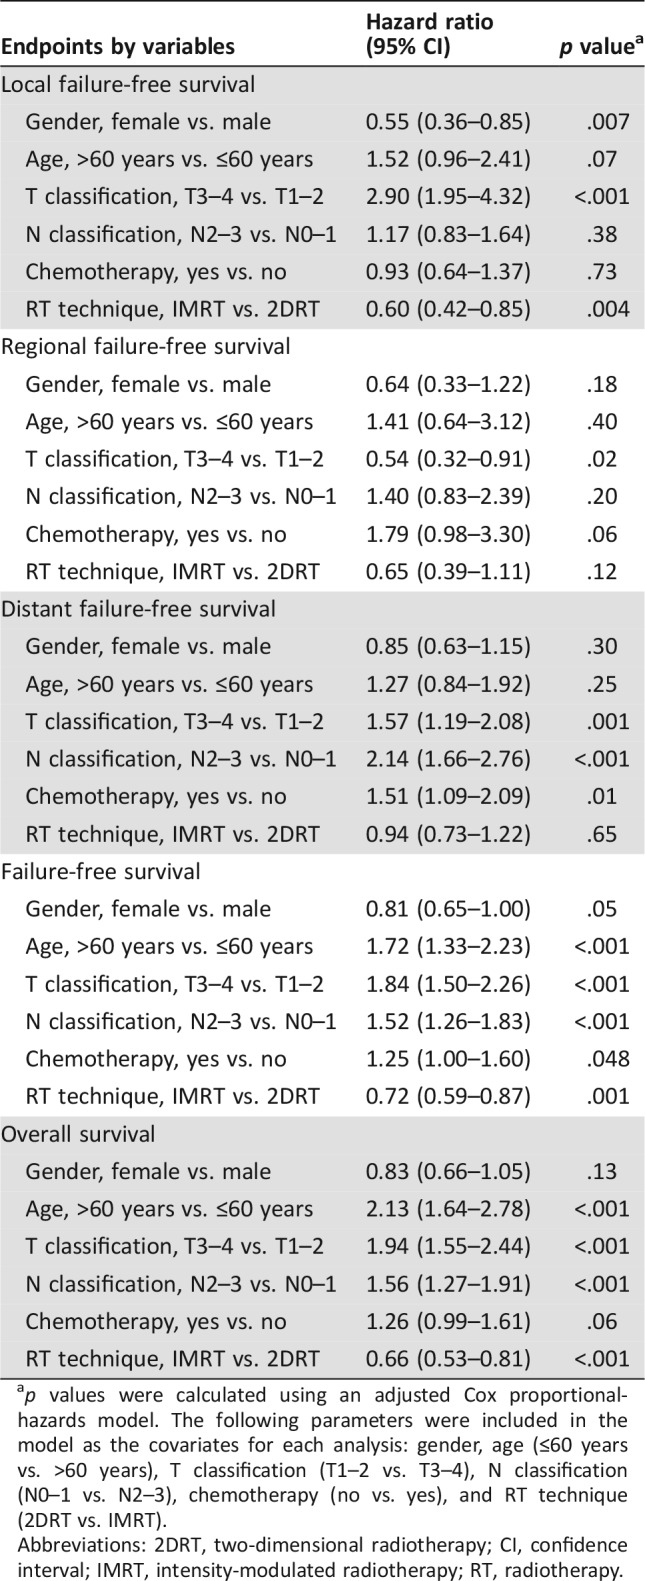
Table 3. Summary of prognostic factors multivariable analyses.

p values were calculated using an adjusted Cox proportional‐hazards model. The following parameters were included in the model as the covariates for each analysis: gender, age (≤60 years vs. >60 years), T classification (T1–2 vs. T3–4), N classification (N0–1 vs. N2–3), chemotherapy (no vs. yes), and RT technique (2DRT vs. IMRT).
Abbreviations: 2DRT, two‐dimensional radiotherapy; CI, confidence interval; IMRT, intensity‐modulated radiotherapy; RT, radiotherapy.
