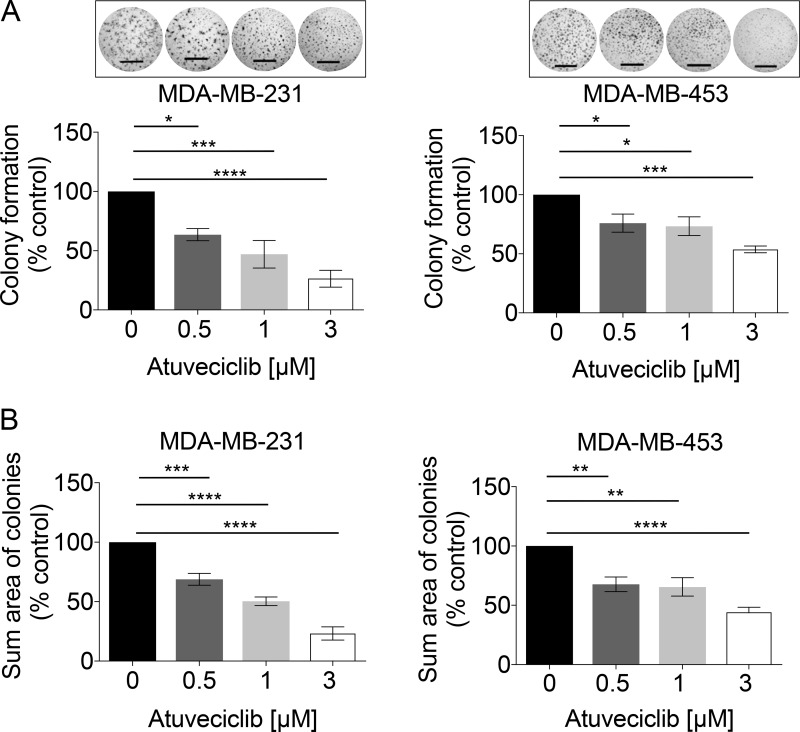
Figure 4. Colony formation analysis in TNBC cell lines in response to increasing doses of atuveciclib.
(A) MDA-MB-231 (left panel) or MDA-MB-453 (right panel) cells were seeded into 96-well plates on a thin layer of EHS tumor extract. After 24 hours, cells were treated with atuveciclib at indicated concentrations. After 6 days entire wells were imaged, and the number of colonies with a diameter ≥ than 60 μm was counted. Data are presented as the percentages of vehicle control (VC) treated cells. Results represent the means ± SEM of four independent experiments for each cell line. Representative images are depicted in the upper panels. *P < 0.05; ***P < 0.001, ****P < 0.0001. (B) MDA-MB-231 (left panel) or MDA-MB-453 (right panel) cells were seeded into 96-well plates on a thin layer of EHS tumor extract. After 24 hours, cells were treated with atuveciclib at indicated concentrations. After 6 days entire wells were imaged, the cross-sectional area of colonies with a diameter ≥ 60 μm was measured and summed up. Sum cross-sectional area data are presented as the percentage of vehicle control (VC) treated cells. Results represent the means ± SEM of four independent experiments for each cell line. Scale bar = 1000 μm. **P < 0.01; ***P < 0.001, ****P < 0.0001.

