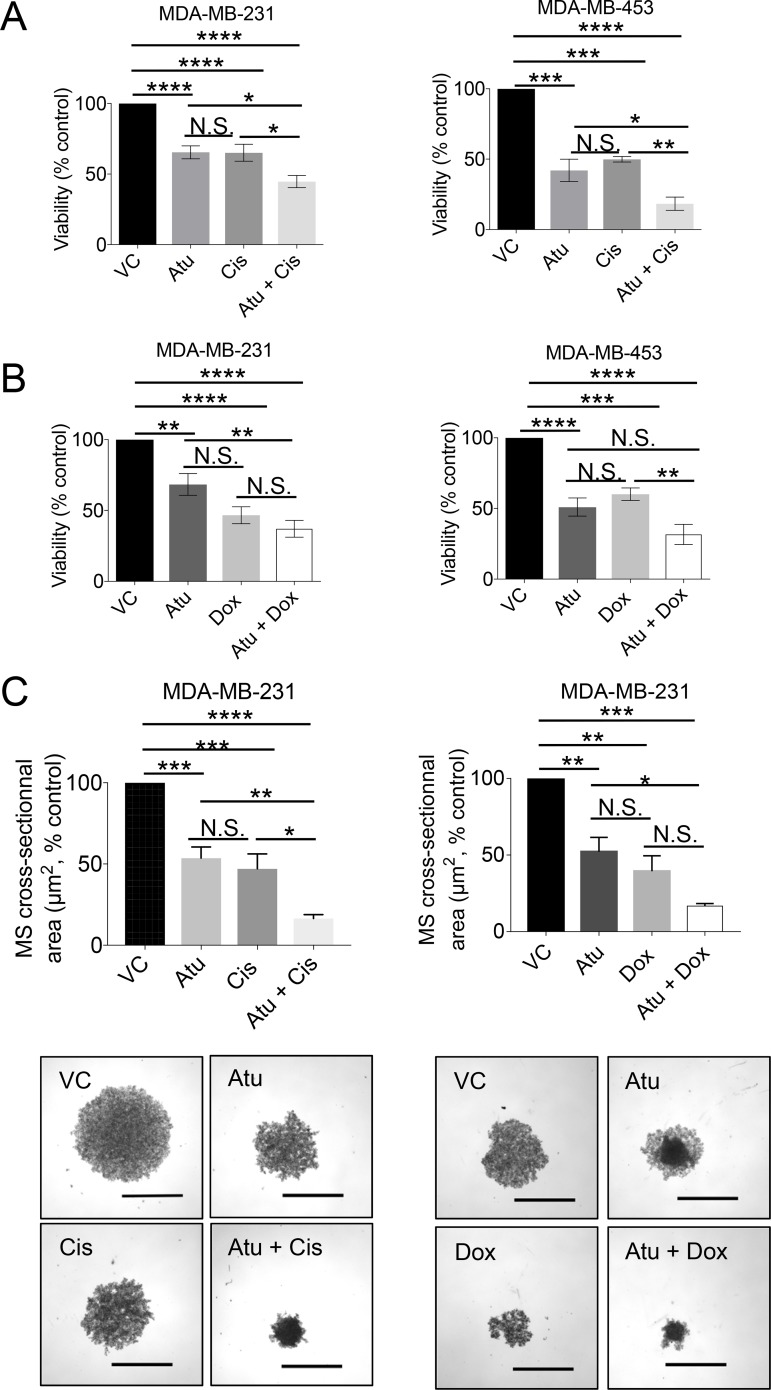
Figure 6. Assessment of cell viability upon atuveciclib treatment in combination with chemotherapy in MDA-MB-231 or MDA-MB453.
(A) MDA-MB-231 (left panel) or MDA-MB-453 (right panel) cells were seeded into 96-well plates. After 24 hours, cells were treated with atuveciclib in combination with cisplatin for 4 days. Cell viability was assessed using the WST-1 proliferation reagent. Data are presented as the percentages of vehicle control (VC) treated cells. Results represent the means ± SEM of six (MDA-MB-231) or three (MDA-MB-453) independent experiments. *P < 0.05; **P < 0.01; ***P < 0.001, ****P < 0.0001. (B) Similar experiment as in A using a combination of atuveciclib and doxorubicin for 4 days. Data are presented as the percentages of vehicle control (VC) treated cells. Results represent the means ± SEM of six (MDA-MB-231) or three (MDA-MB-453) independent experiments. **P < 0.01; ***P < 0.001, ****P < 0.0001. N.S. stands for non-significant. (C) MDA-MB-231 mammospheres (MS) were grown in 96-well low attachment plates in the presence of atuveciclib in combination with cisplatin (left panels) or doxorubicin (right panels). After 8 days, mammospheres were imaged to determine cross-sectional area. Data are presented as the percentages of VC-treated cells. Results represent the means ± SEM of three independent experiments. Representative images are depicted in the lower panels. *P < 0.05; **P < 0.01; ***P < 0.001, ****P < 0.0001. N.S. stands for non-significant. Scale bar represents 1000 μm.

