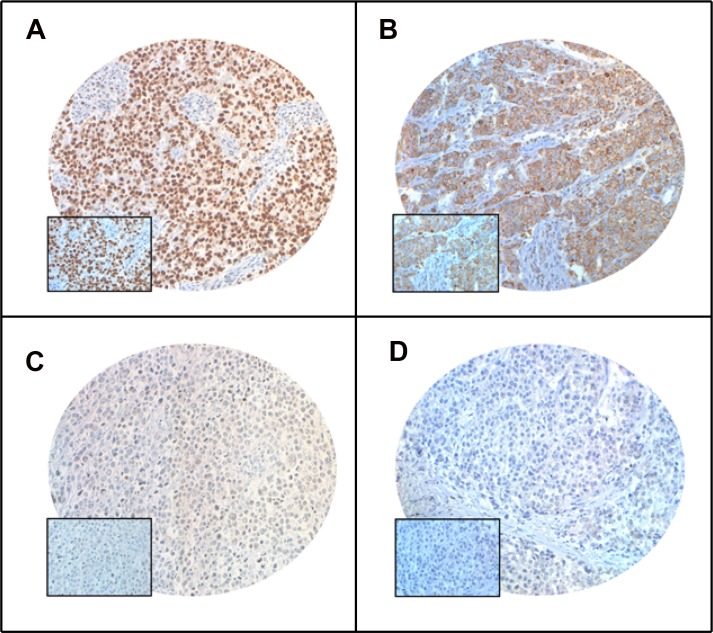
Figure 1. Tissue microarray based immunohistochemistry analysis of PARP and XIAP in breast cancer (BC) patients.
BC TMA spots showing overexpression of PARP (A) and XIAP (B). In contrast, another set of TMA spots showing reduced expression of PARP (C) and XIAP (D). 20 X/0.70 objective on an Olympus BX 51 microscope. (Olympus America Inc, Center Valley, PA, USA) with the inset showing a 40× 0.85 aperture magnified view of the same TMA spot.

