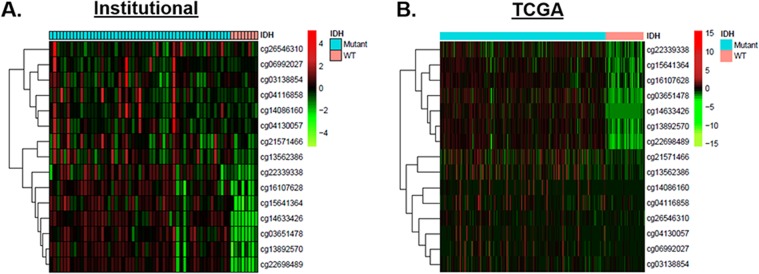
Figure 2. Increased TAGLN2 promoter hypermethylation accounts for decreased TAGLN2 expression in IDH1/2 mutant gliomas.
(A) Promoter methylation was detected in IDH1/2 mutant tumors (n=54, cyan) and IDH1/2 WT tumors (n=8, salmon) from our institutional cohort using 15 CpG TAGLN2 promoter methylation sites included on the Illumina HM-450K array. IDH1/2 mutant showed significantly higher levels of methylation (FDR<0.05) in the majority of CpG islands corresponding to TAGLN2 (n=11), as demonstrated by the heat map. Low methylation levels are denoted in green and high methylation levels are denoted in red. (B) Methylation results were validated using methylation data from the publicly available TCGA cohort.

