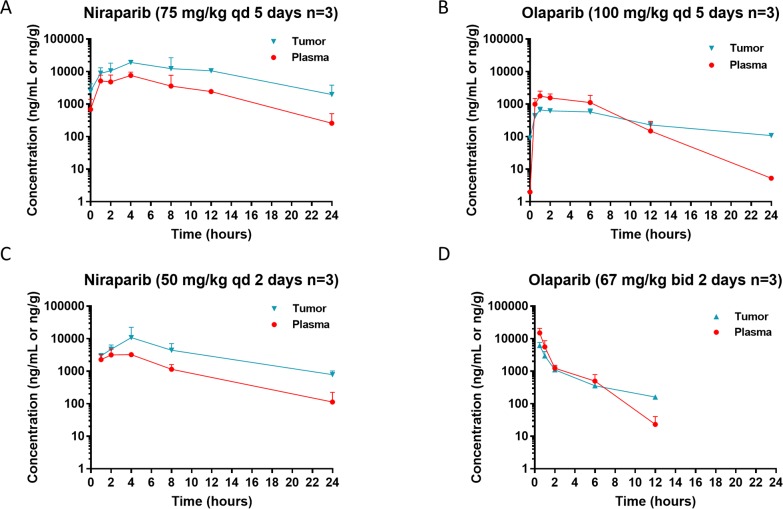
Figure 2. Steady state pharmacokinetics (PK) of niraparib and olaparib in tumor vs plasma.
Tumor and plasma PK in the BRCA1mut MDA-MB-436 TNBC cell line-derived xenograft model (A & B) and BRCAwt OVC134 ovarian cancer PDX model (C & D) treated with niraparib (A & C) or olaparib (B & D) at the maximum tolerated dose. Niraparib and olaparib were administered at 75 or 100 mg/kg once daily, respectively, in MDA-MB-436 model and 50 mg/kg once daily or 100 mg/kg twice daily, respectively in OVC134 model. All mice from MDA-MB-436 model were treated for 5 days, and samples were collected on the last day of treatment at pre-dose and 1, 2, 4, 8, 12, and 24 hours post dose for niraparib and at pre-dose and 0.5, 1, 2, 6, 12, and 24 hours post dose for olaparib. All mice from OVC134 model were treated for 2 days, and samples were collected on the last day of treatment at 1, 2, 4, 8, and 24 hours for niraparib and at 0.5, 1, 2, 6, and 12 hours for olaparib.

