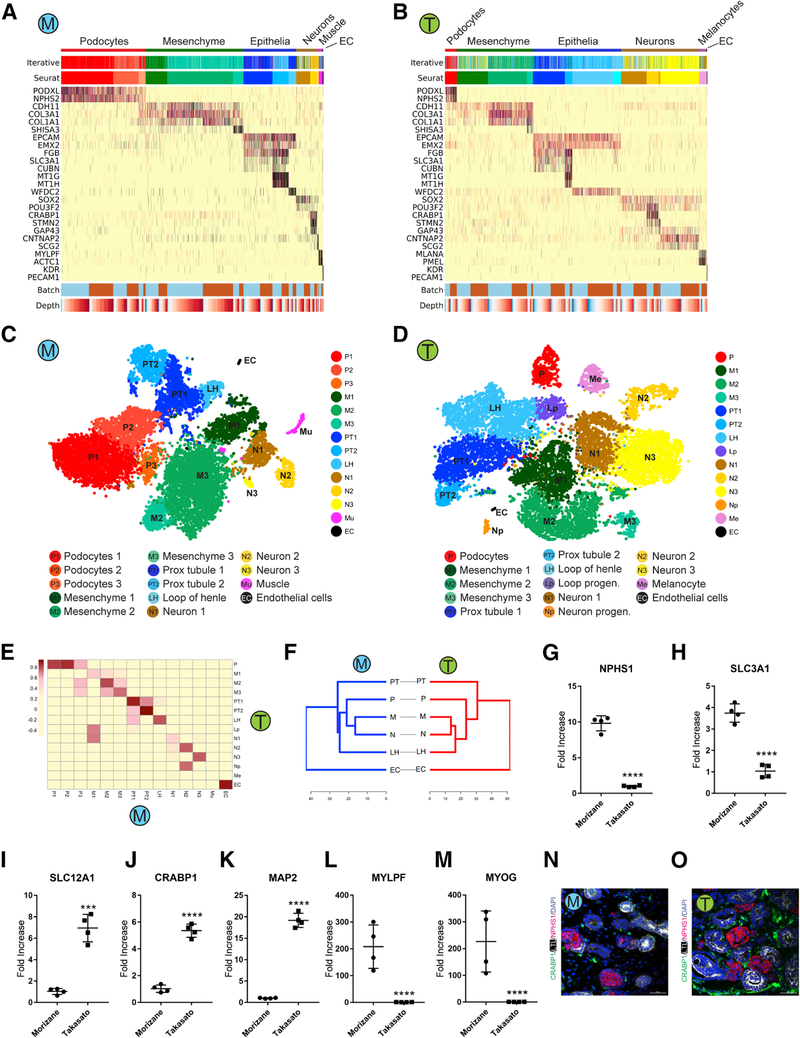
Figure 2: Comparison of kidney cell types and differentiation state in iPS-derived kidney organoids generated with both protocols.
(A,B) Heatmap of all cells clustered by recursive hierarchical clustering and Louvain-Jaccard clustering (Seurat), showing selected marker genes for every population of Morizane protocol (A) and Takasato protocol (B). The bottom bars indicate the batch of origin (“Batch”) and number of UMI detected/cell (“Depth”). (C,D) tSNE plot of cells based on the expression of highly variable genes for the day 26 organoids from Morizane protocol (C) and Takasato protocol (D). The detected clusters are indicated by different colors. (E) Heatmap indicating Pearson’s correlations on the averaged profiles among common cell types for Morizane and Takasato organoids. (F) Dendrogram showing relationships among the cell types in Morizane (left) and Takasato organoid (right). The dendrogram was computed using hierarchical clustering with average linkage on the normalized expression value of the highly variable genes. (G-M) Quantitative PCR comparing cell marker expression for podocyte (NPHS1), PT (SLC3A1), LOH (SLC12A1), neuron (CRABP1 and MAP2), and muscle (MYLPF and MYOG) between organoid protocols. ***p<0.001 and ****p<0.0001. (N,O) Immunofluorescence analysis of neural marker CRABP1 expression (green) in Morizane (N) and Takasato (O) protocols. Cells were co-stained with PT (LTL, white) and podocyte (NPHS1, red) markers. Scale bar, 50 μm.

