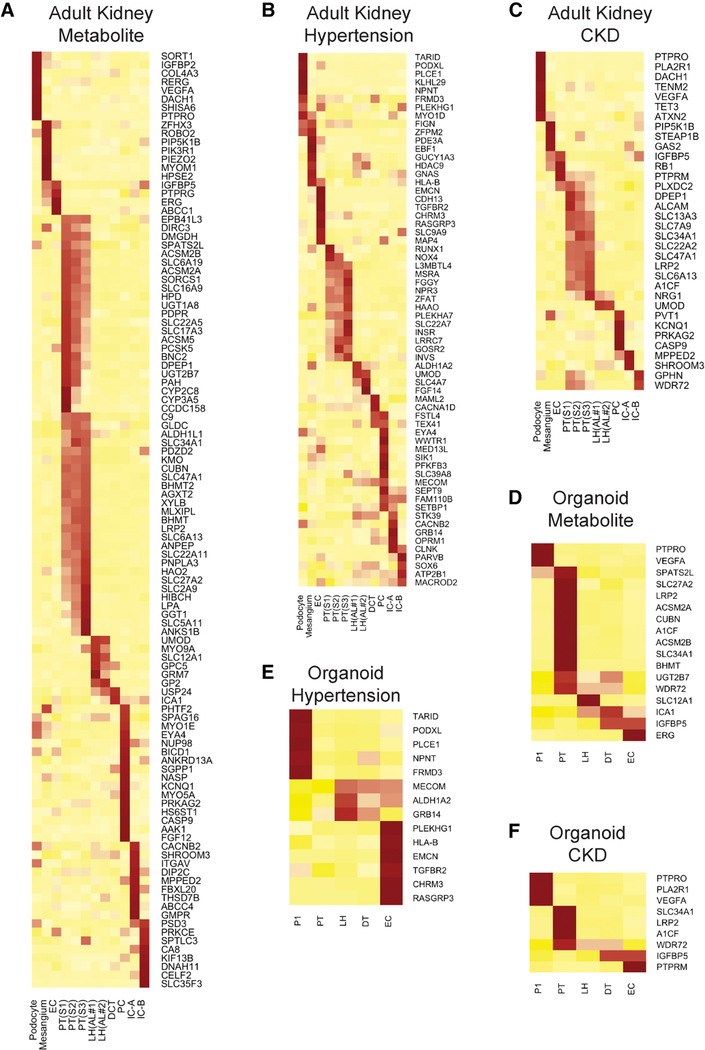
Figure 5: Cell specific expression of disease-relevant genes in adult kidney compared to organoids.
Cell specific expression of genes reported in CKD related GWAS (A), hypertension related GWAS (B), and plasma metabolite levels related GWAS (C) in adult kidney. Each gene reported in a kidney disease related GWAS was assigned to the adult kidney cell type in which it was found to be differentially expressed (likelihood ratio test). Heatmap was used to visualize the z-score normalized average gene expression of the candidate genes for each cell cluster. (D-F) Disease relevant genes identified in (A-C) for which cell-specific expression could also be detected in organoid cell types. Results from both protocols and both cell sources were pooled for the analysis.

