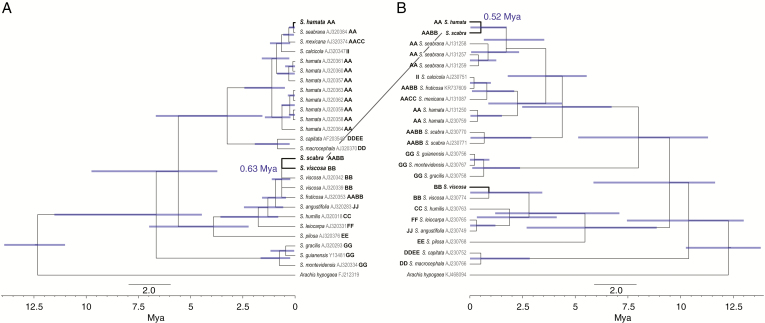
Fig. 7.
Chronogram of Stylosanthes, with focus on the age of S. scabra, based on BEAST analysis using nuclear ITS (A) and plastid trnL–trnF (B). Blue bars indicate 95 % highest posterior density intervals. GenBank accession numbers are given as grey letters on the side of each sample name. Genome structure is given in bold upper case letters after Liu et al. (1999) or Mass and Sawkins (2004).

