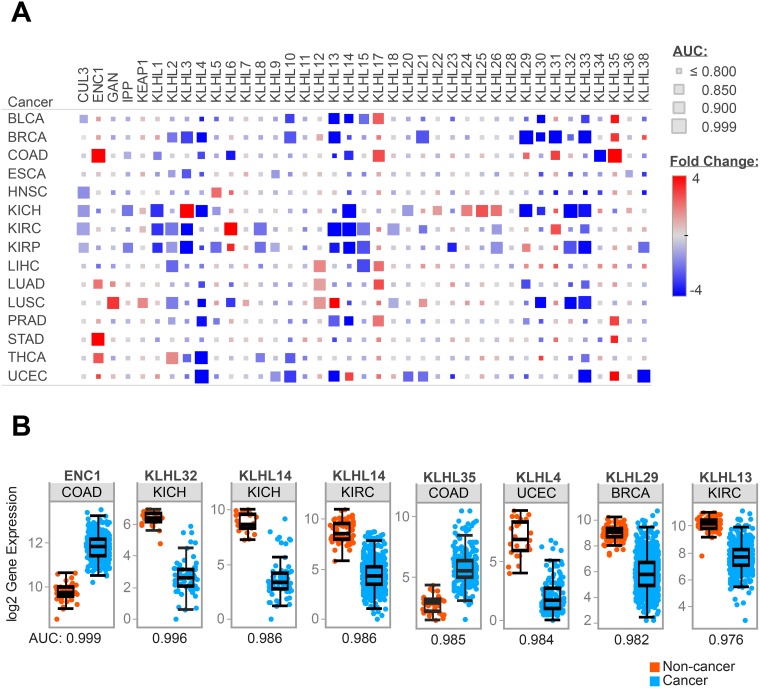
Figure 4. KLHL expression differences in cancer.
Representation of RNAseq data for fifteen TCGA tumor types (A) Heatmap of expression differences between cancer and adjacent normal tissue for KLHLs in the TCGA data. Size of each block reflects AUC from ROC curves comparing cancer vs. normal. (B) Comparison of gene expression in cancer vs. normal for specific KLHLs in TCGA tumor types which demonstrated high AUC values from ROC analysis.

