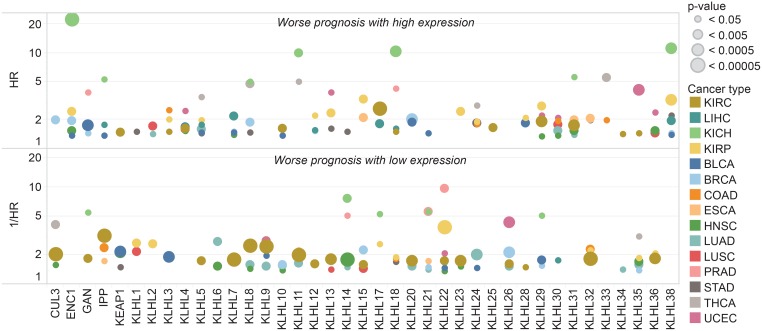
Figure 5. KLHL expression associated with prognostic differences.
Patients with high and low expression of each gene were compared by survival within each TCGA tumor type. Kaplan–Meier survival curves and hazard ratios were calculated for each gene in each cancer separating the patient cohort into two groups at ten percentile increments. Shown are the strongest hazard ratios for any gene-cancer type pair where a significant survival difference p < 0.05 was observed.

