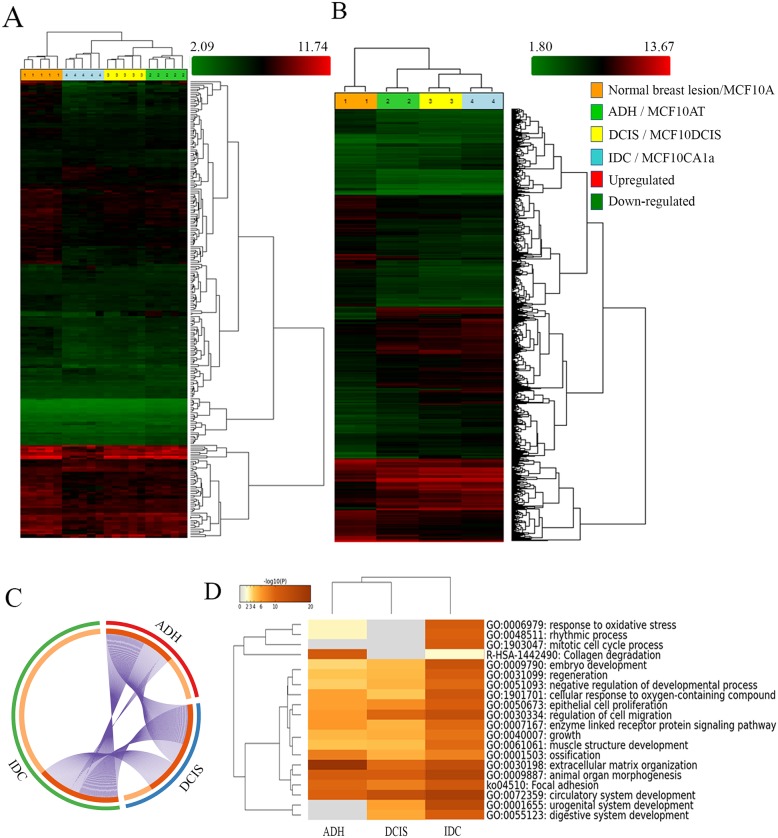
Figure 1. Analysis of BC progression by Human Transcriptome analysis and Metascape.
(http://metascape.org). Hierarchical clustering of breast lesions (A) and representative MCF10A cell lines (B) based on 255 and 2800 differentially expressed gene isoforms, respectively (± 1.5-fold and p < 0.05). Clustering analysis was performed using the Transcriptome Analysis Console (TAC) Software (Thermo Fisher Scientific, Canada). The circos plot showing the gene distribution (± 1.5-fold and p < 0.05) of differentially expressed genes in the three subgroups (ADH, DCIS and IDC) as compared to Normal breast lesions (C). On the outside, each arc represents the identity of each gene list (ADH= Red, DCIS= Blue and IDC= Green). On the inside, each arc represents a gene list, where each gene has a spot on the arc. Dark orange = genes in multiple lists; Light orange = unique to the list. Purple lines link the same genes that are shared by multiple gene lists. Enrichment Ontology cluster across the study (D) depicting statistically enriched pathways clustered based on Kappa-statistical similarities (Kappa score = 0.3). The colour of the heatmap depicts their p-values, white cells = lack of enrichment. Normal breast lesion: benign breast tissue; ADH: Atypical ductal hyperplasia; DCIS: Ductal carcinoma in situ; Invasive: Invasive ductal carcinoma. MCF10A: non-tumorigenic, non-metastatic; MCF10AT (atypical): tumorigenic, non-metastatic; MCF10DCIS (Ductal carcinoma in situ): tumorigenic; locally invasive, non-metastatic and MCF10CA1a (invasive): metastatic.

