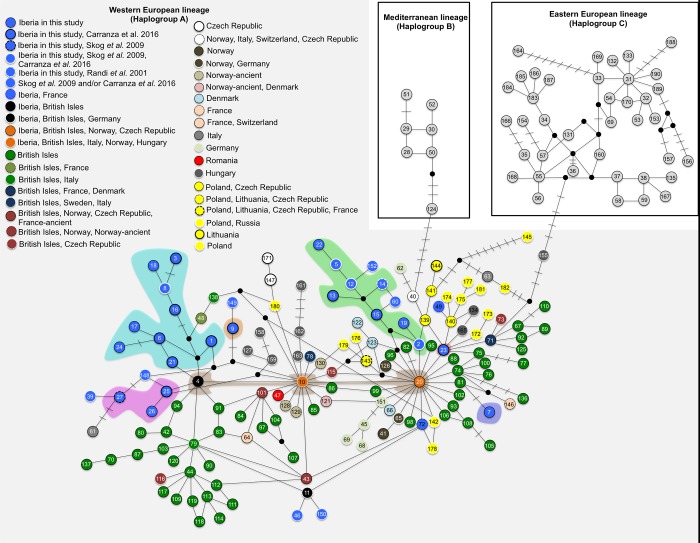
Fig 5. Median joining network showing the evolutionary relationship of mtDNA D-loop haplotypes found both in this study and those published in GenBank (329 bp fragment size) for the red deer in Europe.
A bar in each solid line represents a mutational step; small black circles show undetected/extinct intermediate haplotype states; color codes within the circles are depicted for Western European lineage (haplogroup A) and represent the country where the haplotypes were found. The Iberian sub-lineages are grouped by colored shading following Fig 6. GenBank accession numbers of the 509 original haplotypes used in this analysis, as well as their correspondent haplotypes for 329 bp (represented by numbers within circles) are given in S1 Table.

