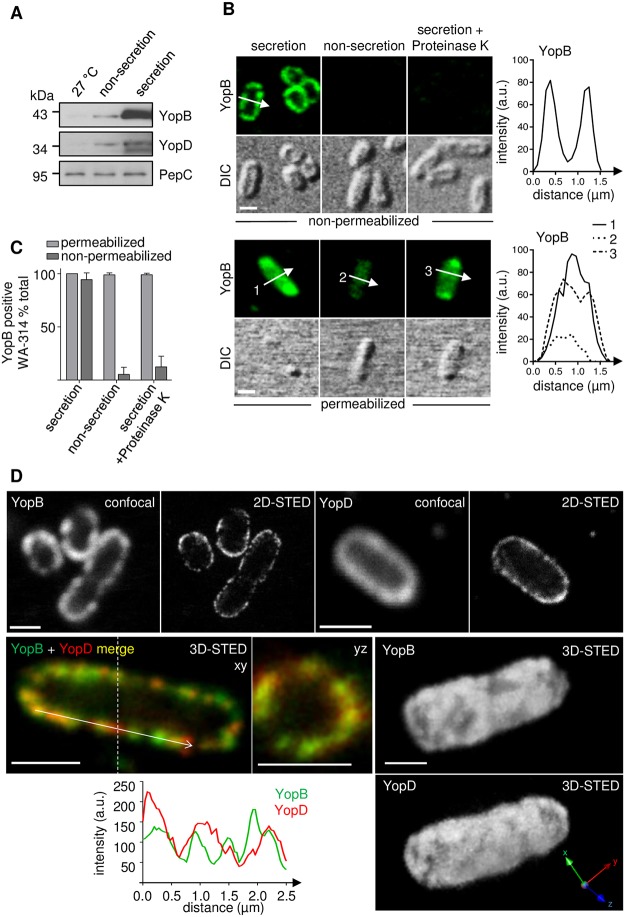
Fig 1. Translocators YopB and YopD decorate the Yersinia cell surface after secretion by the T3SS.
(A) Analysis of YopB- and YopD expression. Lysates of Yersinia WA-314 (wild type) grown at 27°C, at 37°C (high Ca2+/non-secretion) or at 37°C in Ca2+ depleted medium (low Ca2+/secretion) were subjected to SDS-PAGE and analyzed by Western blot for expression of YopB, YopD or PepC, as loading control. (B) and (C) Immunofluorescence staining of YopB in bacterial cells under secretion and non-secretion and cell permeabilizing and non-permeabilizing conditions. Confocal immunofluorescence and corresponding differential interference contrast (DIC) images of Yersinia WA-314 subjected to indicated conditions. Diagrams depict fluorescence intensity profiles (arbitrary units, a.u.) along the arrows in the images. Scale bars: 1 μm. (C) Quantitative analysis of YopB positive bacteria. Bars represent mean ± S.D. of n = 260–800 bacteria from 2–3 independent experiments. (D) Confocal vs. STED imaging of YopB and YopD. Representative confocal and STED images (2D- or 3D-STED as indicated) and 3D reconstructions of surface localized YopB and YopD in wild type Yersinia at secretion condition. Merge of YopB (green) and YopD (red) staining and superimposition of YopB and YopD fluorescence intensity profiles along the arrow on the bacterial surface. yz projection at the level of the dashed line. Scale bars: 1 μm.

