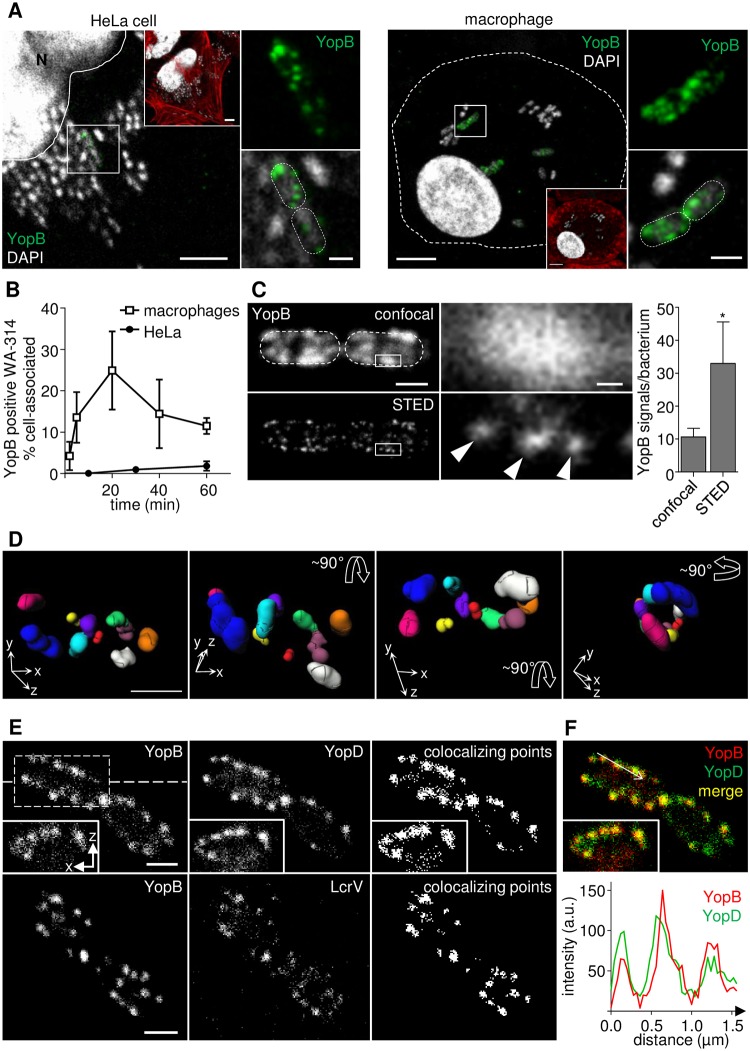
Fig 2. STED imaging of YopB and YopD during Yersinia infection of host cells.
(A) YopB concentrates in distinct patches on host cell associated bacteria. HeLa cells (left panel) and primary human macrophages (right panel) were infected with WA-314 at a MOI of 100 for 2 h and a MOI of 10 for 20 min, respectively. Cells were stained with anti-YopB antibody, Alexa568 phalloidin (as overview; red in insets) and DAPI. White outline indicates position of the nucleus (N) and dashed lines indicate host or bacterial cell circumference. Boxed regions in the center of images are depicted as 2.5-fold enlargements at the side. Scale bars: 5 μm (overviews and insets) and 1 μm (enlargements). (B) The fraction of YopB positive, cell-associated bacteria is dependent on the target cell type. HeLa cells or primary human macrophages were infected with WA-314 at a MOI of 50 or 10, respectively, for the indicated time points and stained as in (A). Data represent mean ± S.D. of n = 4210 bacteria associated with HeLa cells from 2 experiments or n = 3047 bacteria associated with macrophages from 3 different donors (C) YopB patches by confocal microscopy can be resolved into distinct spots by STED microscopy. HeLa cells were infected with WA-314ΔYopE at a MOI of 100 for 60 min and stained for YopB using AbberiorStarRed secondary antibody. Single z-planes of parallel confocal (upper panel) and 2D-STED (lower panel) recordings of two cell-associated bacteria are depicted in overviews. Dashed lines indicate bacterial circumference. Scale bar: 1 μm. Boxed regions in overviews are depicted as 10-fold enlargements on the right. Scale bar: 0.1 μm. The number of distinct YopB signals per bacterium (WA-314YopΔE) was quantified by parallel recordings of z-stacks in confocal and 3D-STED mode. Bars represent mean ± S.D. of n = 27 YopB positive bacteria from two independent experiments; *p < 0.0001 (D) YopB spots are organized in clusters on the bacterial surface. Myc-Rac1Q61L transfected HeLa cells were infected with WA-314 at a MOI of 50 for 60 min and stained with anti-YopB antibody and Abberior635P secondary antibody. Z-stacks were recorded in 3D-STED mode and YopB spots on individual bacteria were subjected to image analysis (Methods). Identified clusters (consisting of at least 2 YopB spots) are projected in different colors and angles in a 3D image of a representative bacterium. Xyz-coordinate axes and arrows indicate position and horizontal or vertical rotation of the bacterium (see also S1 Movie). Scale bar: 1 μm (E) YopB/YopD and YopB/LcrV colocalize in STED images. WA-314ΔYopE infected HeLa cells were co-immunostained for YopB (secondary antibody AlexaFluor-594) and either YopD (Abberior-StarRed) or LcrV (Abberior-StarRed). All images show representative single planes of z-stacks recorded in 3D-STED mode. Insets represent an xz projection at the level of the dashed line. Representation of colocalizing points was generated using the “Colocalization” plugin in ImageJ. Scale bar: 1 μm (F) Merge (yellow) of green (YopD) and red (YopB) fluorescence. Superimposed intensity profiles of YopB and YopD fluorescence along the arrow in merge.

