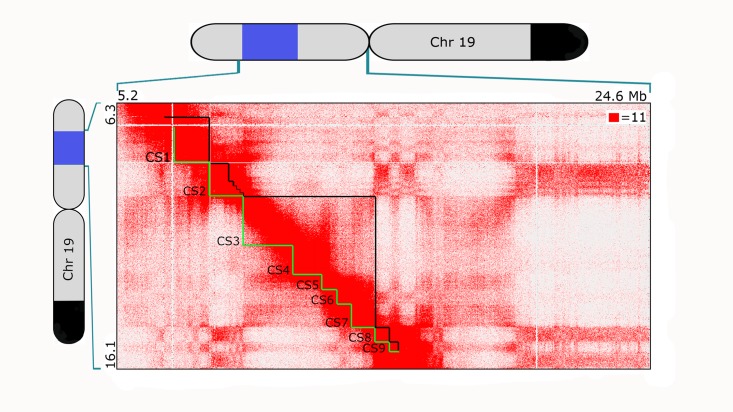
Fig 4. In situ Hi-C map of CS1-9 in PGP1f.
Hi-C map of region including CS1-9, displayed at 25 kb resolution. (See Methods for data processing and normalization.) Contact count indicated by the color of each pixel, ranging from 0 (white) to 11 (red); OligoSTORM steps (CS1-9) delineated in green below the diagonal, and compartmental intervals delineated in black above the diagonal. Cartoons of chromosome 19 show extent of the 8.16 Mb imaged region (blue) and block of SNVs shared between PGP1 and PGP95 (black; as in Fig 1B).

