Figure 4. Arid3a is an input transcription factor for RSREs.
(A) A summary of transcription factor binding motifs on RSREs. (B) arid3a is expressed in nephric tubules. A lateral view of embryos at stage 31 and its transverse section. The upper panels show the in situ hybridization of arid3a.L. The blue arrows indicate the nephric tubules and the white arrows indicate the epidermis. The lower panels show immunostaining using anti-Arid3a using Xla.Tg(Xtr.pax8:EGFP) transgenic tadpole. White arrows: epidermis; orange arrows: proximal tubules; orange arrowheads: glomus and/or nephrocoelom. (C) Arid3a induces lhx1 expression. Xla.Tg(Xla.hsp70:Xtr.arid3a-2A-EGFP) transgenic X. laevis at stage 23 were treated at 34°C for 15 min, followed by 15 min at 14°C. These steps were repeated three times, and tadpoles were incubated at 18°C. lhx1 expression was observed 48 hr after the heat shock at stages 35–36. The signal intensity of in situ hybridization was measured and subjected to statistical analysis. The significance of differences between the control side and the nephrectomized side was calculated using two-tailed unpaired t-test (p=0.0131). The magenta arrows indicate lhx1 expression in proximal and intermediate tubules. N indicates the number of examined embryos. (D) Arid3a directly binds to CNS17, CNS20, and CNS35. Myc-tagged Xtr.arid3a mRNA-injected tadpoles were used for ChIP-qPCR. CNS32 and exon 5 were used as negative elements. The significance of differences between the control IgG and the anti-Myc for Arid3a was calculated using two-tailed unpaired Mann–Whitney t-test: CNS17, p=0.0286; CNS20, p=0.0022; CNS32, p=0.3143 (not significant); exon5, p=0.7000 (not significant); CNS35 (56-334), p=0.0079; CNS35 (314-580), p=0.0022. The error bars indicate SEM. (E) Arid3a activates CNS17 and CNS20. The luciferase reporter assay was performed using HEK293T cells. The significance of differences between the control vector and the CNS-containing reporter was calculated using two-tailed unpaired t-test (CNS17, p=0.0033; CNS20, p=0.0256). The error bars indicate SEM.

Figure 4—figure supplement 1. Transcription binding motifs on CNS17, CNS20, and CNS35.

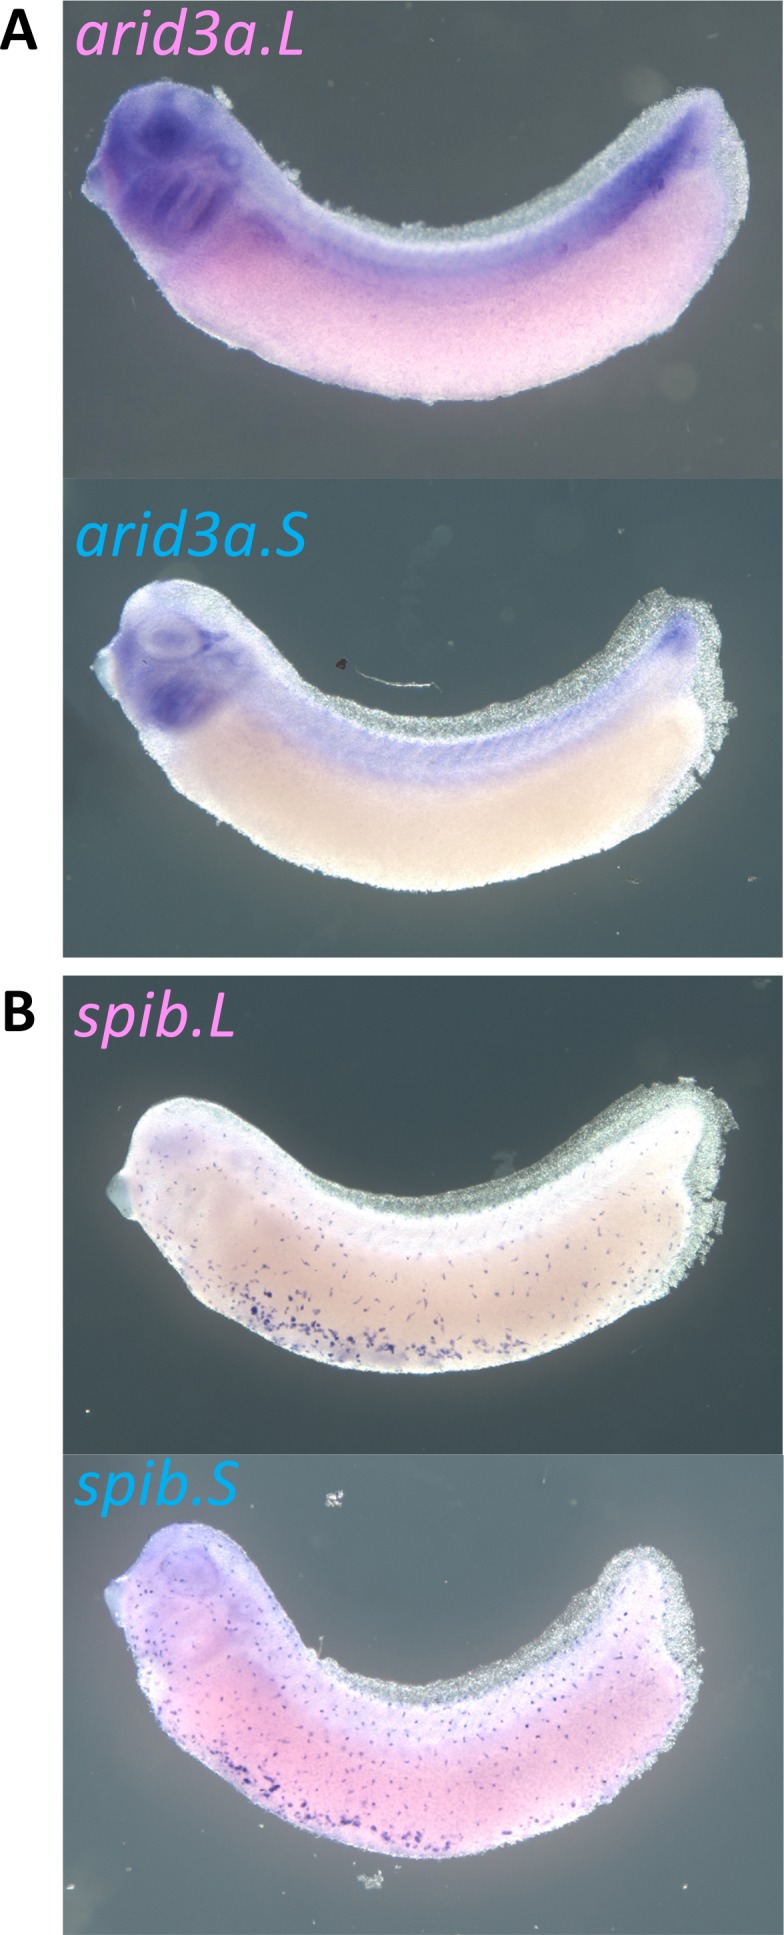
Figure 4—figure supplement 2. Expression of arid3a.L, arid3a.S, spib.L, and spib.S in X. laevis.