
Fig. 3. Dynamics of translocations in space and time.
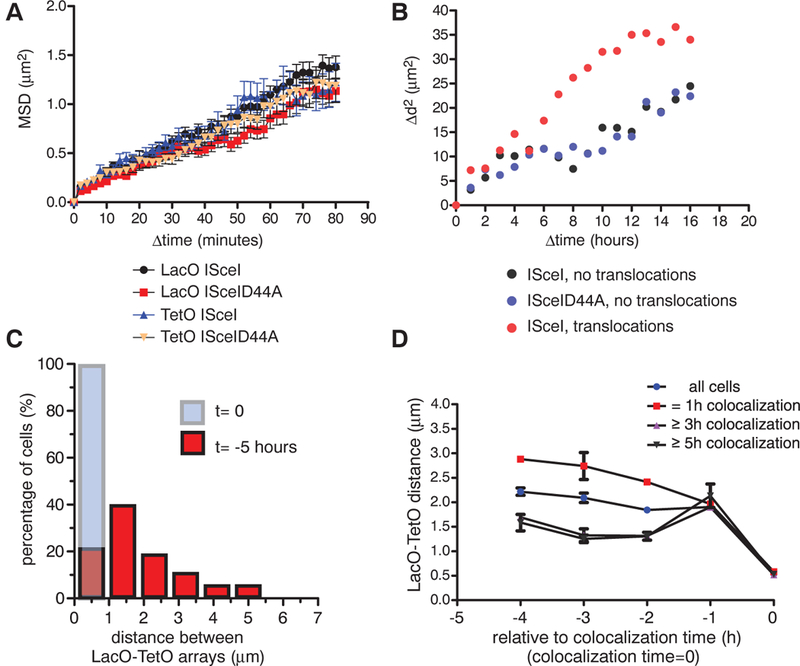
(A) Mean squared displacement (MSD) plots for LacO and TetO in cells transfected with ISceI or ISceID44A. Values represent means ± SEM of pooled data from three independent experiments (n = 66 to 98). (B) Mean squared change in distance (Δd2) between the LacO and the closest TetO array of cells with intact arrays (ISceID44A, n = 34), DSBs without pairing events (ISceI, n = 33), or persistent colocalization (ISceI, pairing ≥3 hours, n = 43). (C) Translocations occur predominantly from proximally located DSBs. Persistent LacO-TetO pairs (≥3 hours) were identified, and distance histograms between LacO and TetO arrays for the time of pairing (t = 0, light blue bar) and 5 hours before (t = −5 hours, red bars) were generated (n = 40). (D) Average LacO- TetO distances as a function of time before pairing for 1 hour, ≥3 hours, and ≥5 hours (all tracks, n = 2897; 1-hour transient interaction, n = 1437; at least 3 hours, n = 615; 5-hour pairing, n = 157). Values represent means ± SD from two independent experiments.