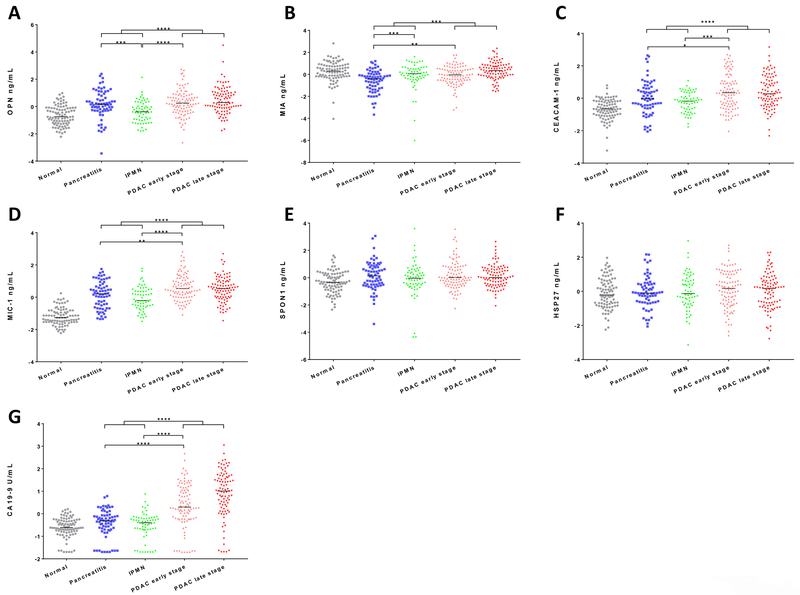
Figure 1. Analysis of biomarkers in sera from PDAC patients, benign conditions, and healthy controls.
A-G, Concentrations of OPN, MIA, CEACAM-1, MIC-1, SPON1, HSP27 and CA19–9 in PDAC patients, benign conditions, and healthy controls. Only serum levels of biomarkers demonstrating significant differences between pancreatitis, IPMN, and PDAC early stage, (or benign and PDAC) are asterisked (Mann-Whitney U test). Bars indicate median value. *, p<0.05; **, p<0.01; ***, p<0.001; ****, p<0.0001.

