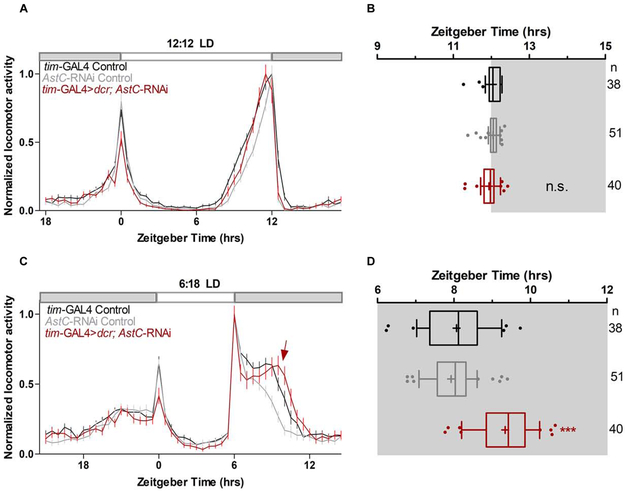
Figure 4. AstC in clock neurons regulates evening phase in short photoperiod days.
A. Normalized averaged actograms of the tim-GAL4 control (black, n= 38), AstC-RNAi control (gray, n= 51), and the AstC RNAi knock-down in all clock cells mediated by tim-GAL4 (red, n= 40) under standard 12:12 light:dark (LD) conditions at 27°C. White and dark boxes indicates the respective light and dark phases. The error bars represent SEM. B. Boxplot distribution showing the evening peak phase from individual flies. There are no significant differences (p ≥ 0.05). C. Normalized averaged actograms of the tim-GAL4 control, AstC-RNAi control, and the AstC RNAi knock-down in all clock cells mediated by tim-GAL4 under short photoperiods of 6:18 LD at 27°C. The red arrow denotes the delay of the evening peak when AstC is knocked-down compared to the two genetic controls. D. Boxplot distribution showing the evening peak phase from individual flies. The tim-GAL4 mediated AstC-RNAi knock-down (red) is significantly delayed compared to both the tim-GAL4 control (black) and AstC-RNAi control (gray; p < 0.0001). These data are combined from two independent biological replicates. *** p < 0.0001. n.s. no significant difference (p ≥ 0.05). “+” indicates the mean and the whiskers denotes the 10th/90th percentiles. At least two biological replicates are averaged here. See also Figures S2, S3, S4, S5, and Table S1.

