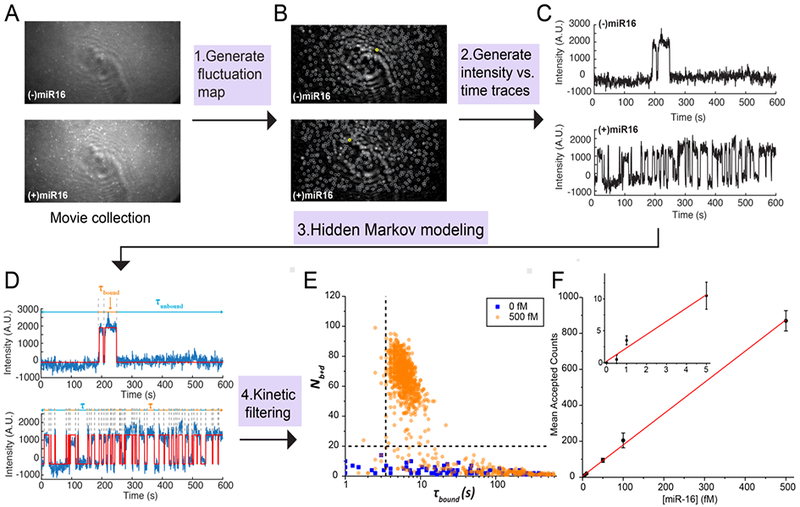
Fig. 3.

Data analysis pipeline. (A) Single-frame images of representative fields of view from TIRF microscopy. (B) Intensity fluctuation maps of the fields of view shown in (A). Grey circles indicate positions of local maxima in the fluctuation map, from which candidate ROIs are identified for further analysis by generation of intensity vs. time traces. (C) Representative intensity vs. time traces generated from the ROIs identified in (B), circled in yellow. (D) HMM idealization (red lines) for each intensity vs. time trace. Bound and unbound-state dwell times (τbound and τunbound, respectively) are indicated by the orange and blue horizontal line segments above the idealization. (E) Candidates in the positive (orange circles) and negative (blue squares) controls for miR-16 are well separated by thresholds of Nb+d > 20 and τbound > 2.5 s (black dashed lines), permitting discrimination of specific and nonspecific binding at the single-molecule level. Data are pre-filtered for signal-to-noise > 2.5 and intensity > 1000. (F) miR-16 standard curve. n = 3 replicates for blank, 2 replicates for other measurements. Error bars represent 1 standard deviation.
