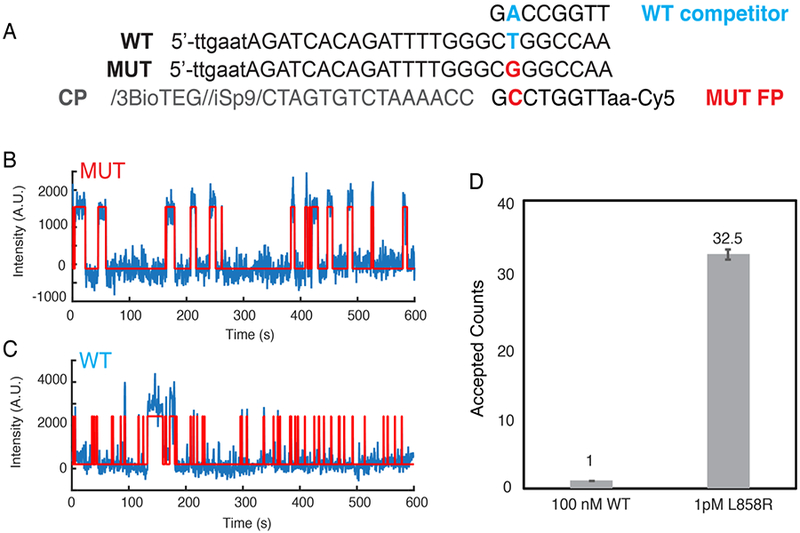
Fig. 4.

Single-base selectivity of SiMREPS. (A) Sequences of WT and L858R MUT targets, as well as the capture probe (CP), MUT fluorescent probe (FP) and WT competitor. (B) Representative intensity vs. time trace from MUT-only positive control. (C) Representative intensity vs. time trace from WT-only control. (D) The accepted counts after kinetic filtering of traces collected in the presence of 100 nM EGFR WT or 1 pM L858R MUT. The apparent discrimination factor between MUT and WT is 3.25 million.
