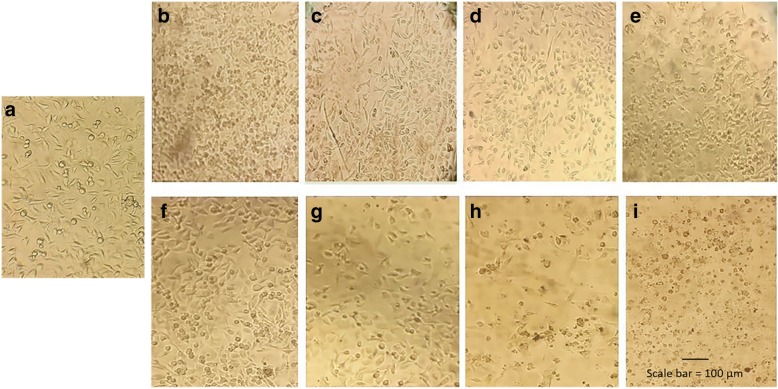
Fig. 8.
Light microscope image (× 10) of cells treated with GNRs. HeLa-untreated cells (a), HeLa treated by 1 nM of CTAB-GNRs (b), 5 nM of CTAB-GNARs (c), 25 nM of CTAB-GNARs (d) and 125 nM of CTAB-GNARs (e) with less viability, and 1 nM of peptide-f-GNRs (f), 5 nM of peptide-f-GNRs (g), 25 nM of peptide-f-GNRs (h), and 125 nM of peptide-f-GNRs (i) with more viability. The cell density decreased, and the morphology changed in CTAB-GNR-treated cells in comparison with cells treated with peptide-f-GNRs

