Fig. 1.

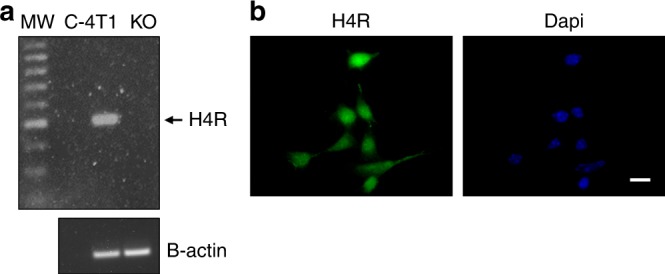
H4R expression was evaluated in 4T1 cells by RT-PCR (a) and immunostaining (b). a Lanes: MW, DNA ladder molecular size marker; C- water replace cDNA, 4T1: cDNA of 4T1 cells, KO: spleen cells of H4R-KO mice were used as negative control. β-actin (521 bp) was used as load control. b Immunofluorescence (green) of H4R in 4T1 cells. Nuclei were counter-stained with Dapi (blue). Scale bar = 20 µm
