Fig. 3.
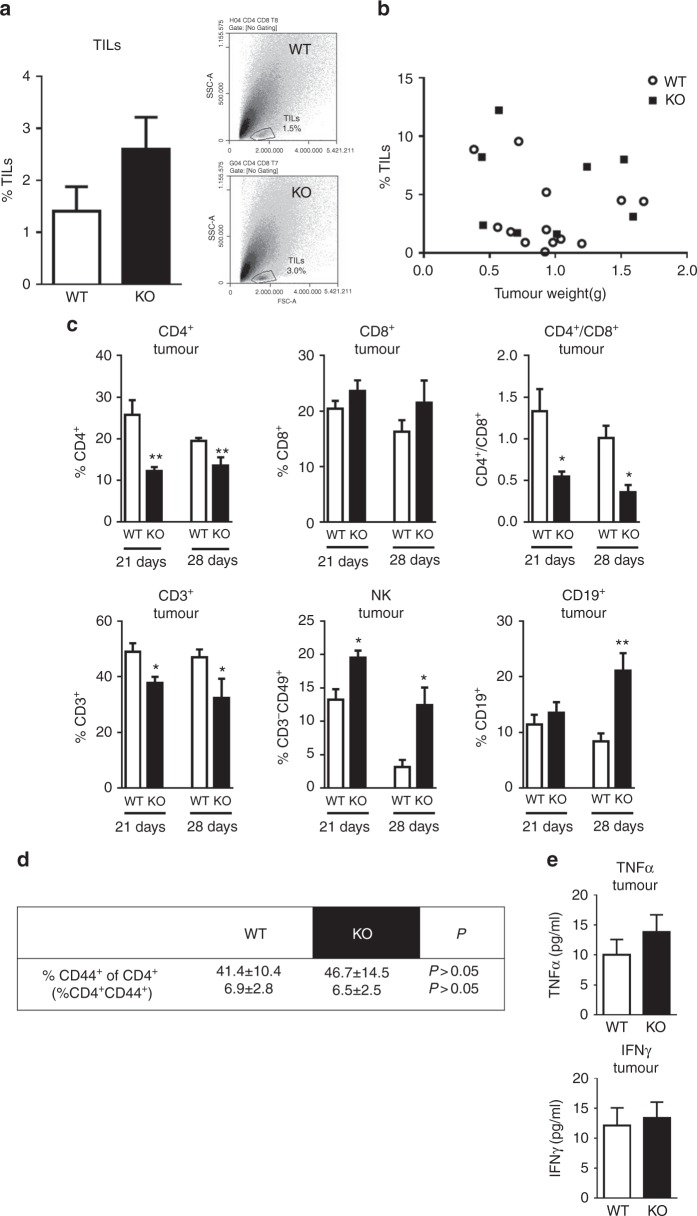
Distribution of immune cell subsets in tumours of 4T1 cells developed in WT and H4R-KO mice. a %TILs: Tumour-infiltrating lymphocytes percentage. Inset: dot plot: SSC-A vs. FSC-A. b Pearson correlation of TILs vs. tumour weight (P>0.05). c, d Tumour cell suspensions were obtained 21 or 28 days p.i. of 4T1 cells and were labelled with specific antibodies: CD4-FITC: T helper lymphocytes marker, CD8-PE: T cytotoxic lymphocytes marker, CD19-PE: B lymphocytes marker, CD49-PE and CD3-FITC: NK markers, CD3-FITC: T lymphocytes marker, CD44-FITC: activated T lymphocyte marker. Ratio CD4+/CD8+. Error bars represent the means ± SEM of three independent experiments (T-test, *P < 0.05, **P < 0.01, ***P < 0.001 vs. WT). e Cytokine concentration in tumour-conditioned medium. Error bars represent the means ± SEM of two independent experiments

