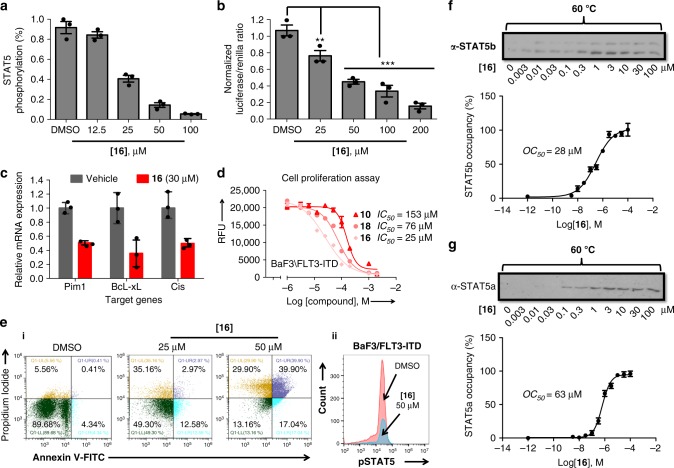
Fig. 5.
Activity, target occupancy, and functional effects of STAT5 inhibitor 16 tested in STAT5-dependent cells. a 16 blocks tyrosine phosphorylation of STAT5 in a dose-dependent manner as shown by western blot analysis in BaF3/FLT3-ITD cells after 6 h treatment. Relative STAT5 phosphorylation levels were plotted as after quantification using Image J software. Immunoblotting for beta-actin was used as a control for uniform protein loading (n = 3). b Compound 16 inhibits transcriptional activity of STAT5 in BaF3/FLT3-ITD cells as measured by normalized Fluc/Rluc ratio in dual luciferase reporter assay (n = 3). c Expression of downstream targets of STAT5 Pim1,BcL-xL and Cis was reduced after 18 h of treatment with compound 16. Gene expression was quantified by quantitative PCR (n = 3). d Compound 16 inhibits the proliferation of BaF3/FLT3-ITD cells after 48 h as determined by the Alamar Blue assay (n = 3). e, i BaF3/FLT3-ITD cells were treated with compound 16 after which annexin-V/propidium iodide staining and flow cytometry were performed (gating strategy as in Supplementary Figure 11a, data shown are one representative of n = 3); (ii) Intracellular levels of phosphorylated STAT5 were evaluated by flow cytometry after 6 h exposure of cells to compound 16 for 50 µm (gating strategy as in Supplementary Figure 11b, data shown are one representative of n = 3). f–g, In-cell occupancy of STAT5a and STAT5b by compound 16 in BaF3/FLT3-ITD, determined using ITDRF. ITDRF of compound 16 on STAT5a and STAT5b denaturization at 60 °C for 3 min based on raw data from western blotting chemiluminescence readings (n = 3). CETSA, cellular thermal shift assay; ITDRF, isothermal dose–response fingerprint; OC50, the concentration at which 50% of the STAT5 in the cell was occupied by inhibitor. For an uncropped image of panels f and g see Supplementary Figure 10. Error bars denote mean ± S.D. and p values are considered as follows: **p value < 0.01; and ***p value < 0.001. Statistical analyses were performed using one-way ANOVA or the two-tailed Student’s t tests where appropriate

