Fig. 2.
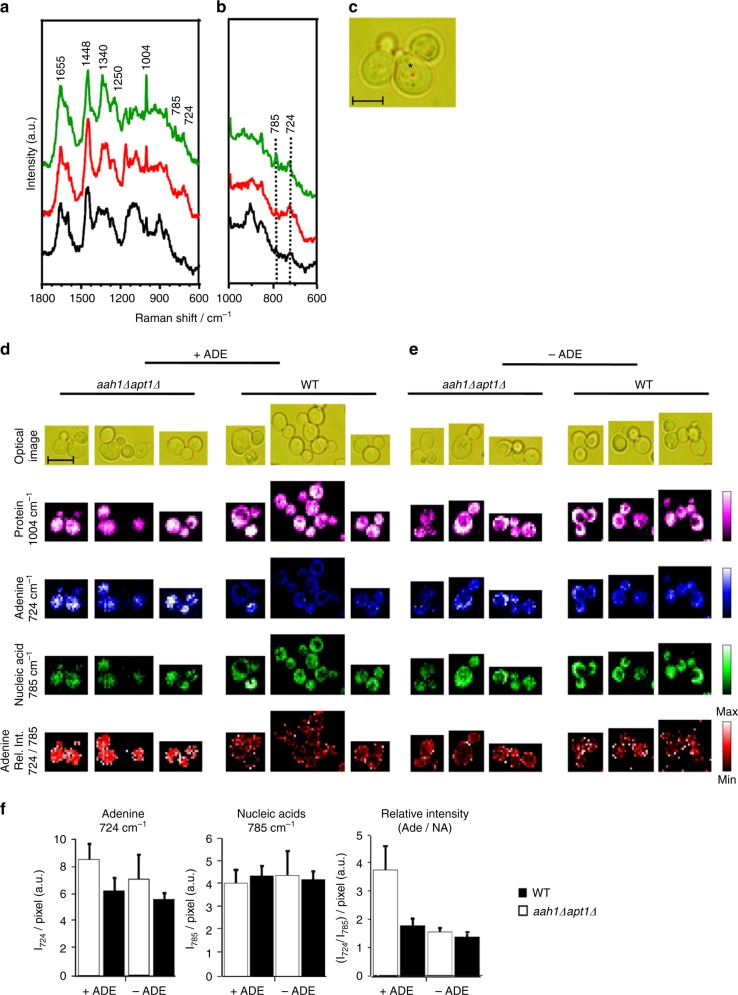
In vivo Raman visualization of adenine accumulation. a–c Space-resolved Raman spectra of mutant yeast (aah1Δapt1Δ). Whole fingerprint region of the Raman spectrum (a) and zoom in of nucleic acids and the adenine marker region (800–600 cm−1) (b) are shown. The corresponding optical image is presented and the measured points are indicated using colored asterisks. Scale bar is 5 µm (c). d and e Raman chemical images of the salvage mutant and wild-type yeast cells in the presence of adenine (d) and in the absence of adenine (e). Raman images of protein (1004 cm−1; magenta), adenine (724 cm−1; blue), nucleic acids (785 cm−1; green) and the relative intensity of adenine and nucleic acids (724/785 cm−1; red) are presented. Corresponding optical images are included for reference. Rel. Int., relative intensity. Scale bar is 5 µm. f Calculated average intracellular intensity from yeast cells of 724 cm−1 per pixel, 785 cm−1 per pixel, and relative intensity of WT and aah1Δapt1Δ yeast cells. P < 0.02 (Student’s t-test). Values are the mean ± s.d. of three experiments

