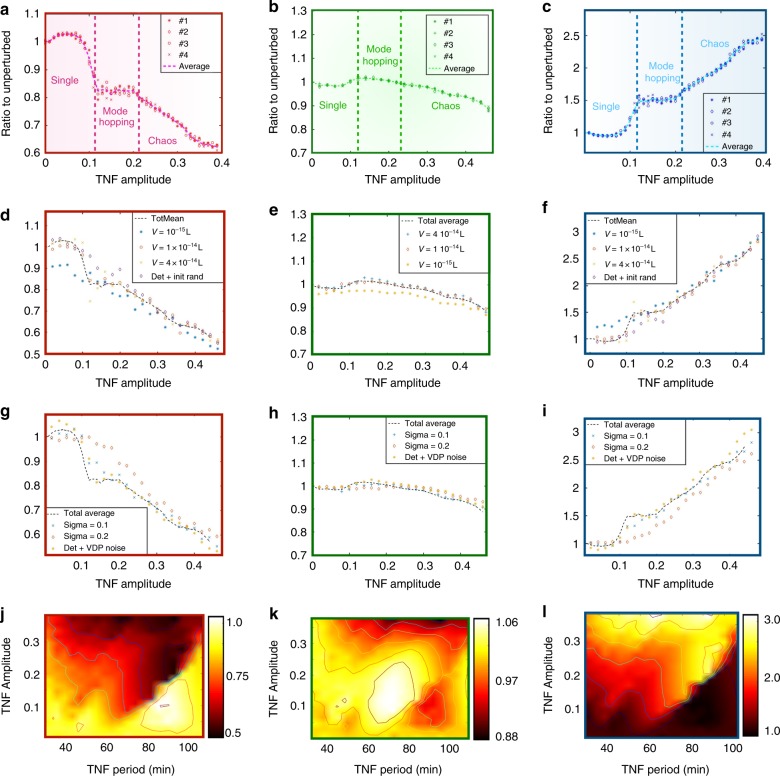
Fig. 2.
Effects of chaos on protein production. a The average protein level from an HAG (K = 4.5, h = 4), for different values of the TNF amplitude. We performed four separate simulations of duration 5*105 min. and show their individual means and the mean of these four combined. We used V = 2*10−14L and T = 50 min. Results for other periods are found in SI. b Same as a but for MAG (K = 2, h = 3). c Same as a but for LAG (K = 1, h = 2). d The average production from the HAG for different intrinsic noise levels. We performed simulations of duration 1*105 min each datapoint and used the total mean as calculated in a–c. Here T = 50 min. e Same as d but for the MAG. f Same as d but for the LAG. g The average production from the HAG for different extrinsic noise levels. We performed simulations of duration 1*105 min each datapoint and used the total mean as calculated in a and b. We added Langevin noise to the oscillator and used and , and in the last dataseries (yellow *) we used the Van der Pol oscillator with noise as a perturbation to TNF (see Supplementary Note 4). Here T = 50 min. h Same as g but for the MAG. i Same as g but for the LAG. j The average production from the HAG, for different values of the TNF amplitude and period. The bright colours indicate the maximal average protein levels, while the dark colours correspond to low average protein levels. k Same as j but for the MAG. l Same as j but for the LAG

