Fig. 4.
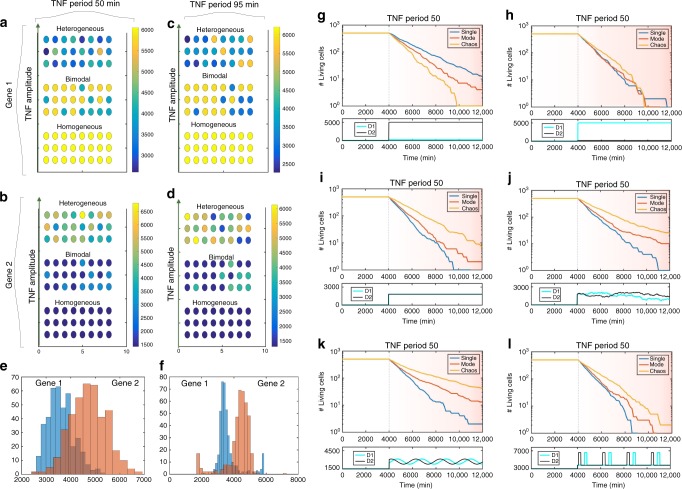
Population heterogeneity emerges from chaos. a Protein concentration from an HAG with K = 1, h = 2 and external TNF period 50 min. Bottom: The concentration corresponding to a single-mode oscillation; TNF amplitude: 0.04. Middle: The concentration corresponding to mode-hopping; TNF amplitude: 0.12. Top: The concentration corresponding to chaos; TNF amplitude: 0.36. b Protein concentration from an LAG with K = 4.5, h = 4. TNF period 50 min. TNF amplitudes are identical to those used in a. c Protein concentration from the HAG. TNF period 95 min. Bottom: The concentration corresponding to a single-mode oscillation; TNF amplitude: 0.1. Middle: The concentration corresponding to mode-hopping; TNF amplitude: 0.2. Top: The concentration corresponding to chaos; TNF amplitude: 0.4. d Protein concentration from the LAG. TNF period 95 min. TNF amplitudes are identical to those used in c. e Distribution of protein concentrations in the chaotic state (TNF period: 50 min, TNF amplitude: 0.36). f Distribution of protein concentrations in the chaotic state (TNF period: 95 min, TNF amplitude: 0.4). g Number of surviving cells vs. time (drug is added at T = 4000 min). D1 = 6000, D2 = 0. h Same as g with D1 = 0, D2 = 6000. i Same as g with D1 = D2 = 3000. j Same as g with and D1+2(0) = 3000. The panel below shows a specific trajectory on this pattern. In general D1 is above D2 50% of the times and vice versa. k Same as g with . l Same as g with D1+2(t) = 7000 if and otherwise D1+2(t) = 3000

