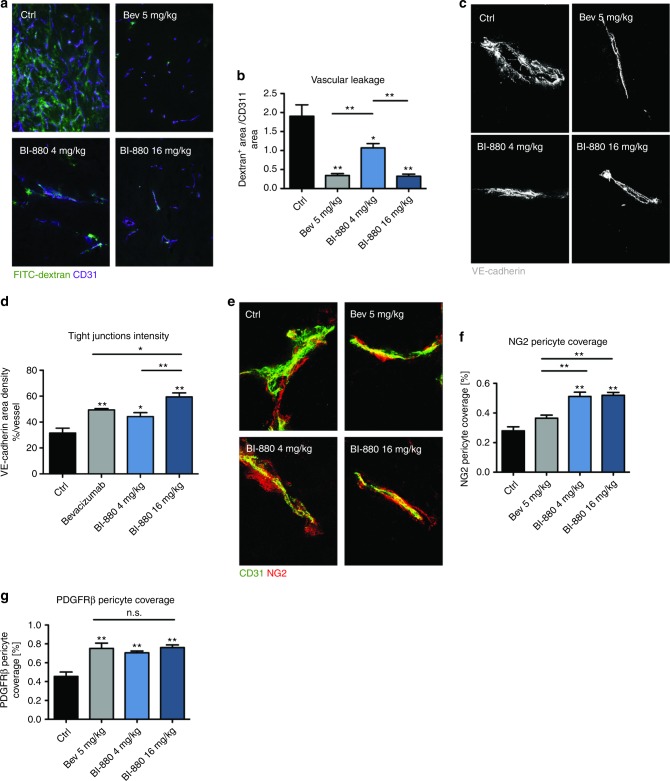
Fig. 4.
Treatment-induced vessel normalisation. a Images of FITC-dextran (green) perfused tumour blood vessels (purple) and b quantification of vascular leakage. c High-magnification images (600×) of VE-Cadherin (grey) stained tumour vessel endothelium and d quantification of tight-junction integrity. e High-magnification images (600×) of tumour blood vessels stained for CD31 (green, EC) and NG2 (red, pericytes) and f quantification of NG2 pericyte coverage and g quantification of PDGFRβ pericyte coverage. *p < 0.05, **p < 0.01, n.s. not significant

