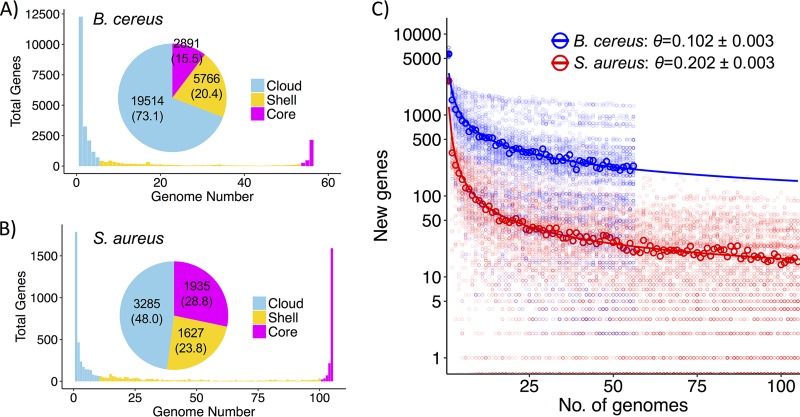
FIG 1.
Pangenome summary statistics. (A and B) Histogram distributions of cloud, shell, and core genes. Pie chart displays numbers of total genes with percentages in parentheses. (C) Power-law fit to the mean number of new genes per genome (bold points) after 100 pangenome permutations (i.e., background points). Θ < 1 indicates that the pangenome is in the “open” state (79).

