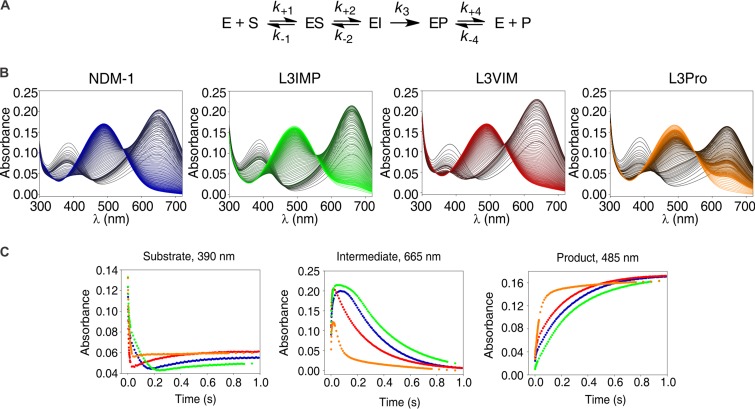
FIG 5.
Photodiode array stopped-flow spectra and traces of nitrocefin hydrolysis by NDM-1 and its L3 variants. (A) Reaction mechanism for nitrocefin hydrolysis by NDM-1 (adapted from Yang et al. [32]). (B) Electronic absorption spectra upon the reaction of 10 μM nitrocefin and 10 μM enzyme in 100 mM HEPES (pH 7.5), 0.2 M NaCl, and 0.3 mM ZnSO4 at 6°C. The reaction progresses from black to color: NDM-1 in blue, L3VIM in red, L3IMP in green, and L3Pro in orange. Absorption bands with peaks at 390, 485, and 605 nm correspond to maximum absorption of the substrate, product, and the anionic intermediate of the reaction, respectively. (C) Temporary profiles of substrate (390 nm), intermediate (665 nm), and product (485 nm) during the reaction described in panel A. Traces: NDM-1, blue; L3VIM, red; L3IMP, green; L3Pro, yellow.

