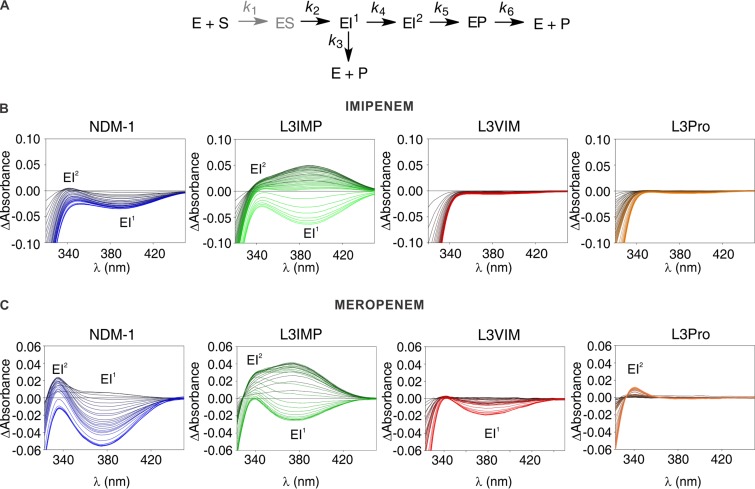
FIG 6.
Photodiode array stopped-flow spectra of carbapenems hydrolysis by NDM-1 and the L3 variants. (A) General reaction mechanism for carbapenems hydrolysis by MβLs (adapted from Lisa et al. [33]). The ES complex does not accumulate and is thus depicted in a lighter color (gray). (B) Sequence of difference spectra collected upon the reaction of 100 μM imipenem and 100 μM β-lactamase. The reactions progress from black to color: NDM-1, blue; L3VIM, red; L3IMP, green; and L3Pro, orange. The ionic intermediates, EI1 and EI2, were detected as absorption bands with maxima at 390 and 343 nm. The time interval spans up to 0.2 s. (C) Sequence of difference spectra upon the reaction of 100 μM meropenem and 100 μM enzyme. The reactions progress from black to color: NDM-1, blue; L3VIM, red; L3IMP, green; and L3Pro, orange. The ionic intermediates, EI1 and EI2, were detected as absorption bands with maxima at 390 and 330 nm. The time interval spans up 0.2 s.

