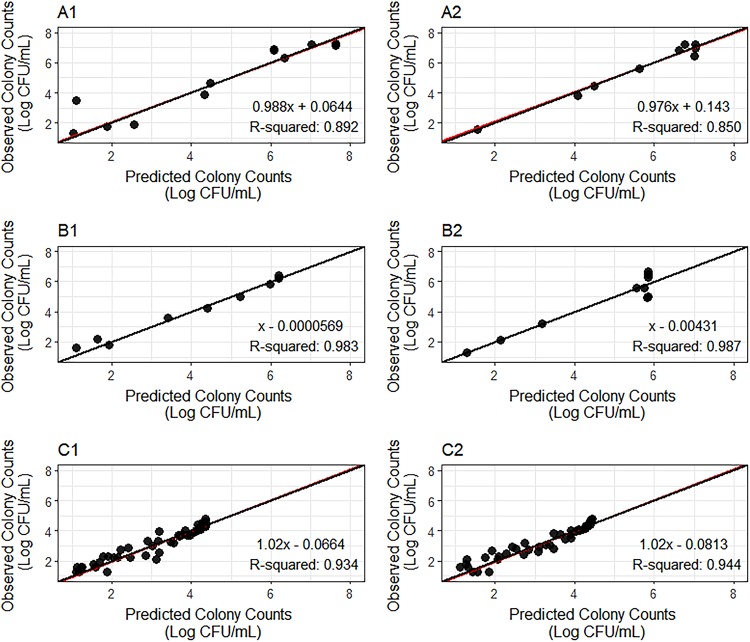
FIG 3.
Observed versus predicted colony counts for the H37Rv strain at log phase (A1 and A2) and acid phase (B1 and B2) and for the 18b strain at NRP phase (C1 and C2). Panels 1 and 2 are replicates for the same experiment. Red lines, the regression line over the observed versus model-predicted colony counts; black lines, unity lines; black full circles, observation/prediction pairs.

