
FIG 1.
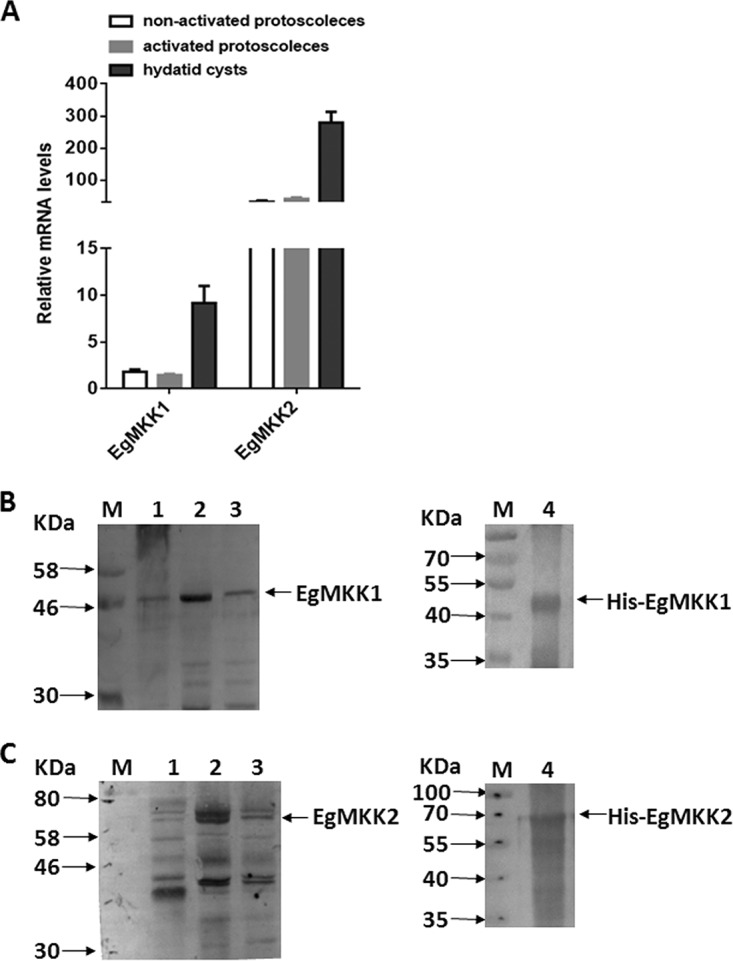
mRNA and protein levels of EgMKK1 and EgMKK2 expression in the larval stages. (A) Quantitative PCR analysis of EgMKK1 and EgMKK2 mRNA levels. Quantitative real-time PCR analysis was performed on total RNA isolated from nonactivated PSCs, activated PSCs, and hydatid cysts. Shown is a bar graph comparing the relative expression levels (means ± SD) of EgMKK1 and EgMKK2 normalized to the levels of Egelp. The relative expression value was averaged from triple samples. (B and C) Immunoblot detection of the EgMKK1 (B) and EgMKK2 (C) proteins. Cell lysates of nonactivated PSCs (lane 1), activated PSCs (lane 2), in vitro-cultivated cysts (lane 3), and Escherichia coli BL21 expressing a His-EgMKK1 fusion protein or a His-EgMKK2 fusion protein (lane 4) were separated on a 12% SDS-polyacrylamide gel. Protein marker sizes are indicated to the left (M).