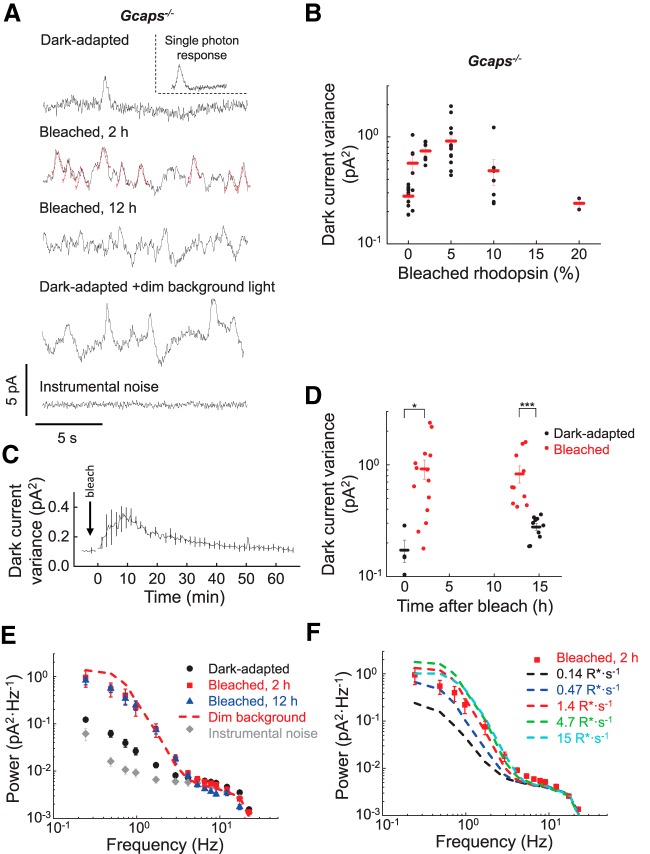
Figure 1.
Bleach-induced discrete transduction activity in single Gcaps−/− rods in darkness. A, Current recorded in darkness from a dark-adapted unbleached rod (dark-adapted), a rod after 1.4% rhodopsin bleach followed by 2 h incubation in darkness (bleached, 2 h), and a rod 12 h after a 1.4% rhodopsin bleach (bleached, 12 h). For comparison, the fourth trace shows the current recorded from an unbleached rod in 500 nm dim background light producing an estimated 1.4 R* s−1 (dark-adapted + dim background light). The bottom trace (instrumental noise) shows the rod instrumental noise recorded in bright background light. To illustrate the similarity between the discrete events in bleached rods and the single-photon response, individual events in the bleached, 2 h trace have been overlapped with the corresponding single photon response (drawn in red). Inset, Single photon response waveform estimated from dim flash responses of a dark-adapted rod. B, Total dark current variance of rods with increasing fractions of bleached rhodopsin (black circles). Red bars show mean ± SEM. C, Averaged rod dark current variance recorded over the course of 65 min after a 1.4% bleach (n = 3). D, Total dark current variance of dark-adapted rods (black circles) or rods 2 h (left) or 12 h (right) after 1.4% rhodopsin bleach (red circles). Bars show mean ± SEM of each group of data points. *p < 0.05, ***p < 0.005 by two-tailed unpaired t test. E, Averaged power spectra of the dark current recorded from rods that were dark-adapted (dark-adapted, black circles, n = 10), after a 1.4% rhodopsin bleach and incubation in darkness for 2 h (bleached, 2 h, red squares, n = 8) or for 12 h (bleached, 12 h, blue triangles, n = 9), or in bright background light (instrumental noise, n = 6). Dashed line is the power spectrum from unbleached rods under dim background light (n = 3) as in A. F, Comparison of the power spectrum of bleached rods (red squares) with the power spectra of unbleached rods in a series of backgrounds ranging from 0.14 to 15 R* s−1. Plots are shown as mean ± SEM.

