Figure 6.
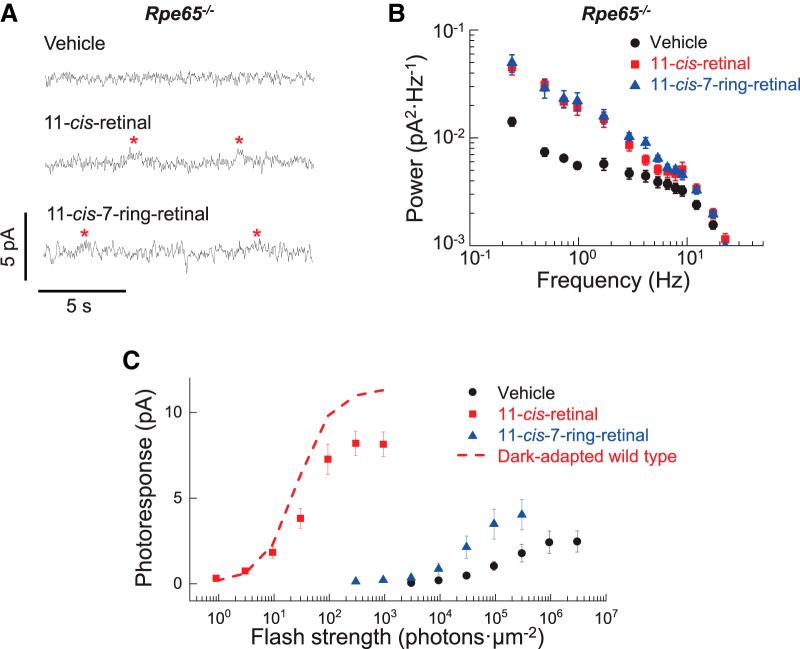
Transduction activity in Rpe65−/− rods after pigment regeneration. A, Current recorded from Rpe65−/− rods incubated in darkness for 3 h with vehicle for control (vehicle), 100 μm exogenous 11-cis-retinal (11-cis-retinal), or 11-cis-7-ring-retinal (11-cis-7-ring-retinal) for pigment regeneration. Asterisks denote discrete photoresponse-like events. B, Averaged power spectra of the dark current recorded from rods incubated in darkness for 3 h with vehicle (vehicle, black circles, n = 8), 100 μm exogenous 11-cis-retinal (11-cis-retinal, red squares, n = 9), or 100 μm 11-cis-7-ring-retinal (11-cis-7-ring-retinal, blue triangles, n = 14). C, Averaged intensity–response relations of rods incubated in darkness for 3 h with vehicle (vehicle, black circles, n = 8), 100 μm exogenous 11-cis-retinal (11-cis-retinal, red squares, n = 8), or 100 μm 11-cis-7-ring-retinal (11-cis-7-ring-retinal, blue triangles, n = 8). Responses were obtained by 2 or 20 ms of calibrated flash stimulation from a 505 nm LED. The red dash line is an averaged intensity-response relation of dark-adapted WT rods (n = 4) for comparison. Plots in B and C are shown as mean ± SEM.

