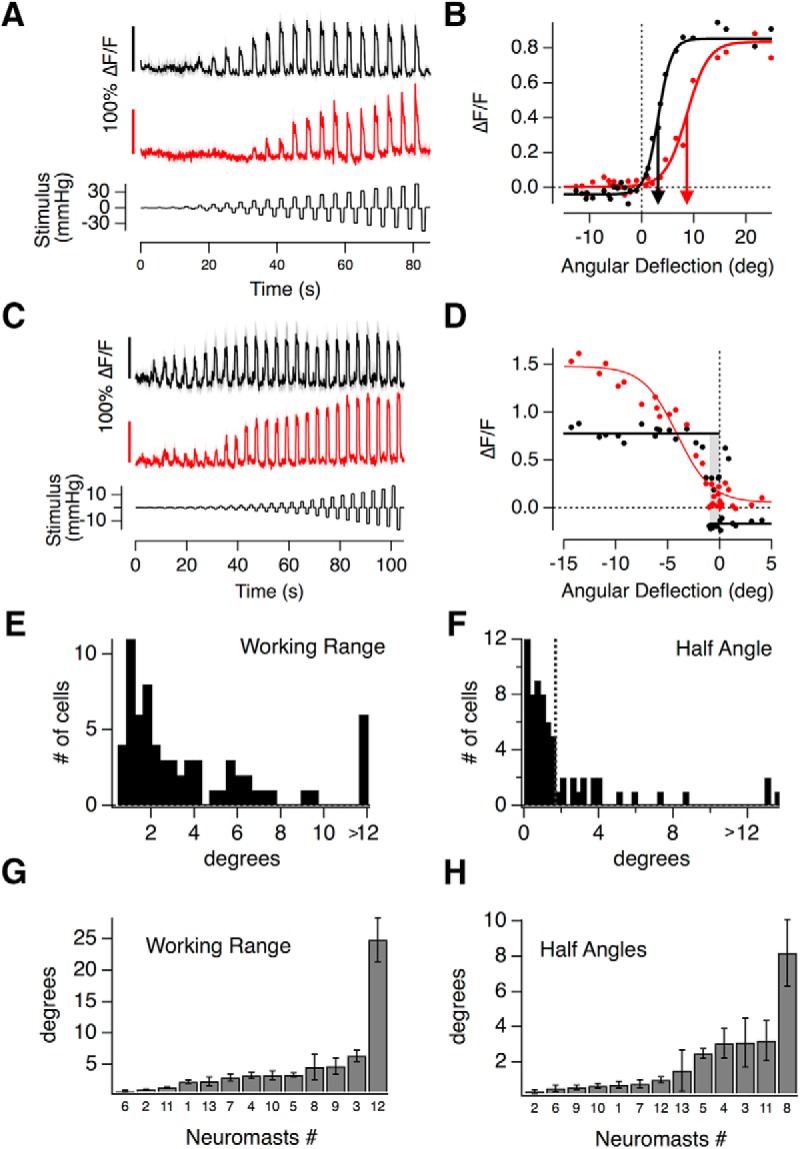
Figure 3.

The transfer characteristics of hair cells in the lateral line. A, iGluSnFR responses of two hair cells recorded in the same neuromast, both responding to positive pressure steps. The top one (black) responds to smaller deflections than the bottom one (red). The relationship between cupula deflection and applied pressure in this neuromast was 0.6 deg/mmHg. B, Peak iGluSnFR signals (R) from A plotted as a function of the angular deflection of the cupula (X). These stimulus-response relations could be described by a two-state Boltzmann function (Eq. 3), with parameters Rmax, Rmin, X1/2, and Xs: Rmax(1) = 0.89 ± 0.02, Rmin(1) = −0.04 ± 0.01, X1/2(1) = 3.19 ± 0.15°, and Xs(1) = 1.28 ± 0.15, Rmax(2) = 0.83 ± 0.02, Rmin(2) = 0.00 ± 0.01, X1/2(2) = 8.65 ± 0.34°, and Xs(2) = 2.07 ± 0.3. C, iGluSnFR responses of two hair cells from another neuromast, which differ more significantly in their WR. D, Stimulus–response relations of the hair cell in C. The hair cell depicted in red had a WR of 7°, and the one in black <1° (gray bar). C, D, The relationship between applied pressure and measured cupula deflection in this neuromast was 1.9 deg/mmHg. E, A histogram of WRs (the deflection required to increase the response from 10 to 90% of maximum) measured in 67 hair cells. Approximately 30% have WRs within 1.5°. The last bin contains all hair cells >12°. F, Histogram of the half angles (X1/2, the rotation at half maximum response) in 67 hair cells. The majority (75%) had X1/2 < 2° (dashed line). G, H, The average WRs and half-angles of hair cells from 13 different neuromasts, ranked in order. The neuromast number is indicated below each bar. No correlation between these metrics could be detected using a Spearman rank correlation test (error bars indicate SEM).
