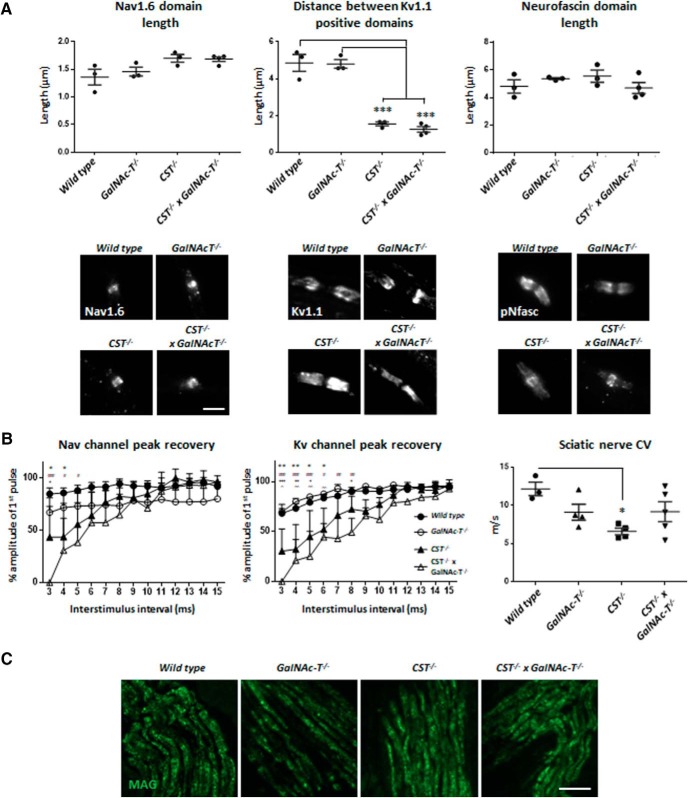
Figure 3.
The additional loss of complex gangliosides on a sulfatide-null background does not augment disorganization at the NoR or electrophysiological function in the peripheral nervous system. A, There is modest Nav1.6 channel cluster domain lengthening in both CST−/− and CST−/− × GalNAc-T−/− teased SNs that does not reach significance. Representative images from teased SNs immunostained for Nav1.6 show that Nav channel cluster appearance was similar in every genotype. Disturbance of the paranode is indicated by invasion of Kv1.1 channels into the paranode, shown by a decrease in the gap between positive domains. The gap between Kv1.1-positive domains is significantly and comparably decreased in both CST−/− and CST−/− × GalNAc-T−/− mice compared with WT and GalNAc-T−/− NoRs. Representative images show that Kv1.1 formed two distinct domains of immunostaining at the juxtaparanodes in WT and GalNAcT−/− mice. Conversely, mice lacking sulfatide expression had Kv1.1 staining at the paranodes, suggesting disruption to the axo–glial junction. The length of pNFasc-immunostained domains does not significantly differ among genotypes. However, representative images show that labeling greatly differs: WT and GalNAc-T−/− NoRs have pNFasc staining that is most intense at the paranodes, forming two clear dimers (“normal”), whereas both CST−/− and CST−/− × GalNAc-T−/− mice have intense staining at the nodal gap (presumed NF186) with weaker paranodal (presumed NF155) staining (“abnormal”), which indicates a disturbance in paranodal adhesion (WT, n = 3; GalNAc-T−/−, n = 3; CST−/−, n = 3; and CST−/− × GalNAc-T−/−, n = 4). Scale bar, 5 μm. B, Perineural recordings of Nav and Kv channel currents from intercostal nerves showing an increase in recovery time for both peaks following paired pulse stimulation in both CST−/− and CST−/− × GalNAc-T−/− mice compared with WT and GalNAc-T−/− mice. The CST−/− and CST−/− × GalNAc-T−/− mice were not significantly different from each other at any ISI. Graphs display the means and ±SEM for each genotype (WT n = 5, GalNAc-T−/− n = 2, CST−/− n = 3, CST−/− × GalNAc-T−/− n = 2) and statistical analysis performed (two-way ANOVA; #WT vs CST−/− × GalNAc-T−/− mice; *WT vs CST−/−; +GalNAc-T−/− vs CST−/− × GalNAc-T−/−; ∧GalNAc-T−/− vs CST−/− × GalNAc-T−/−). SN conduction velocity decreased in CST−/− (n = 4), GalNAc-T−/− (n = 4), and CST−/− × GalNAc-T−/− (n = 5) mice compared with WT (n = 3), but only reached significance in CST−/− nerves. C, Peripheral nerve MAG immunostaining was comparable among genotypes. Scale bar, 20 μm. Graphs display the means and ±SEM for each genotype and statistical differences among genotypes were determined by one-way ANOVA followed by Tukey's post hoc tests to compare multiple comparisons, indicated on the graphs as follows: *p < 0.05; **p < 0.01; ***p < 0.001.

