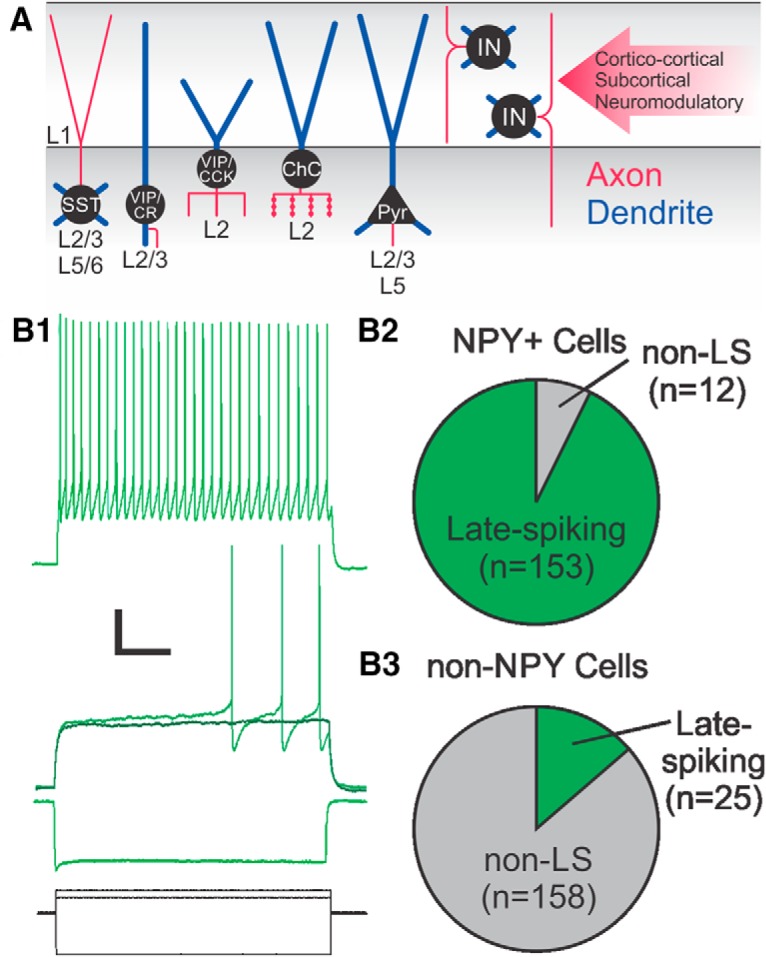
Figure 1.

Enrichment of LS L1 labeled INs in NPY-hrGFP mice. A, Schematic of the circuit components of L1. Cell bodies are shown in black, axons in red, and dendrites in blue. Red arrow on the right shows long-range inputs arriving at L1. B1, Recording of a L1 LS NPY IN (green) in response to hyperpolarizing, just subthreshold, near-threshold, and suprathreshold current injections (current steps are shown in black at the bottom). Note the long delay to first spike during the threshold depolarization. This delay is absent in non-LS cells, which have onset spike(s) at threshold. Scale bars, 20 mV or 400 pA, 200 ms. B2, Pie chart showing the number of LS cells recorded in NPY+ L1 INs in green; non-LS cells in gray. B3, Pie chart showing the number of LS cells recorded in non-NPY L1 INs in green; non-LS cells in gray. Pyr, pyramidal cell; ChC, chandelier cell; CR, calretinin; CCK, cholecystokinin.
